66

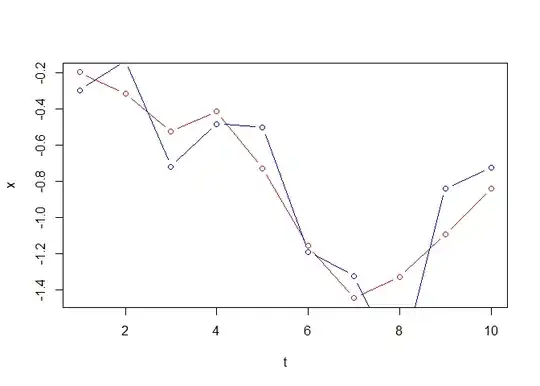
I have two time series, shown in the plot below:

Time Series Plot

The plot is showing the full detail of both time series, but I can easily reduce it to just the coincident observations if needed.

My question is: What statistical methods can I use to assess the differences between the time series?

I know this is a fairly broad and vague question, but I can't seem to find much introductory material on this anywhere. As I can see it, there are two distinct things to assess:

1. Are the values the same?

2. Are the trends the same?

What sort of statistical tests would you suggest looking at to assess these questions? For question 1 I can obviously assess the means of the different datasets and look for significant differences in distributions, but is there a way of doing this that takes into account the time-series nature of the data?

For question 2 - is there something like the Mann-Kendall tests that looks for the similarity between two trends? I could do the Mann-Kendall test for both datasets and compare, but I don't know if that is a valid way to do things, or whether there is a better way?

I'm doing all of this in R, so if tests you suggest have a R package then please let me know.

robintw
  • 1,977
  • 4
  • 24
  • 23
  • 14
    The plot appears to obscure what may be a crucial difference between these series: they might be sampled at different frequencies. The black line (Aeronet) seems to be sampled only about 20 times and the red line (Visibility) hundreds of times or more. Another critical factor may be the regularity of sampling, or lack thereof: the times between Aeronet observations appear to vary a little. In general, it helps to *erase* the connecting lines and display only the points corresponding to actual data, so that the viewer can determine these things visually. – whuber Nov 29 '11 at 18:11
  • 1
    [Here](https://traces.readthedocs.io/en/latest/) is a Python library for unevenly-spaced time series analysis. – kjetil b halvorsen Nov 04 '18 at 13:12
  • Drop a link to [a lecture notes](https://www.maths.usyd.edu.au/u/jchan/Consult/W10_CompareTwoTimeSeries.pdf) that discussed this problem for future readers – Tung Sep 01 '21 at 05:40
  • Not a great fan of Mann-Kendall. You could fit a GAM to each series and at least compare the confidence envelopes. There's probably a way to statistically compare the two fits formally too. – Simon Woodward Sep 12 '21 at 19:26

5 Answers5

35

As others have stated, you need to have a common frequency of measurement (i.e. the time between observations). With that in place I would identify a common model that would reasonably describe each series separately. This might be an ARIMA model or a multiply-trended Regression Model with possible Level Shifts or a composite model integrating both memory (ARIMA) and dummy variables. This common model could be estimated globally and separately for each of the two series and then one could construct an F test to test the hypothesis of a common set of parameters.

Nick Cox
  • 48,377
  • 8
  • 110
  • 156
IrishStat
  • 27,906
  • 5
  • 29
  • 55
  • 1
    Well, you don't really need to have the same frequency for both series. It just that so fare there is little software for other cases, but see https://traces.readthedocs.io/en/latest/. It seems like much is pubslihed about other cases in astronomy journals and in finance and geophysics ... see refs in https://en.wikipedia.org/wiki/Unevenly_spaced_time_series – kjetil b halvorsen Nov 04 '18 at 18:05
16

Consider the grangertest() in the lmtest library.

It is a test to see if one time series is useful in forecasting another.

A couple references to get you started:

https://spia.uga.edu/faculty_pages/monogan/teaching/ts/

https://spia.uga.edu/faculty_pages/monogan/teaching/ts/Kgranger.pdf

http://en.wikipedia.org/wiki/Granger_causality

UmNyobe
  • 103
  • 4
fionn
  • 161
  • 2
3

Just came across this. Your first answer us plotting g the two sets the same scale (timewise) to see the differences visually. You have done this and can easily see there are some glaring differences. The next step is to use simple correlation analysis...and see how well are they related using the correlation coefficient (r). If the r is small your conclusion would be that they are weakly related and so no desirable comparisons and a larger value if r would suggest good comparisons s between the two series. The third step where there is good correlation is to test the statistical significance of the r. Here you can use the Shapiro Welch test which would assume the two series are normally distributed (null hypothesis ) or not (alternative hypothesis). There are other tests you can do but let me hope my answer helps.

Richard
  • 31
  • 1
  • 2
    When comparing time series it is autocorrelation and possibly fitting time series models. such as ARIMA models that can help determine how similar they are. Two realizations of the same stochastic process don't necessarily look the same when plotting them. – Michael R. Chernick Feb 09 '19 at 02:28
  • 1
    @MichaelR.Chernick But often when comparing time series you are more interested in the particular realisations than the statistical properties. – Simon Woodward Sep 02 '21 at 01:09
2

I want to propose another approach. This is to test whether two time series are the same. This approach is only suitable for infrequently sampled data where autocorrelation is low.

If time series x is the similar to time series y then the variance of x-y should be less than the variance of x. We can test this using a one sided F test for variance. If the ratio var(x-y)/var(x) is significantly less than one then then y explains a significant proportion of the variance of x.

We also need to check that x-y is not significantly different to 0. This can be done with a one sample two sided t.test.

x <- cumsum(runif(10)-0.5)
t <- seq_along(x)
y <- x + rnorm(10, 0, 0.2)
# y <- x + rnorm(10, 0.2, 0.2)
plot(t,x, "b", col = "red")
points(t,y, "b", col = "blue")

var.test(x-y, x, alternative = "less") # does y improve variance of x?
#> 
#>  F test to compare two variances
#> 
#> data:  x - y and x
#> F = 0.27768, num df = 9, denom df = 9, p-value = 0.03496
#> alternative hypothesis: true ratio of variances is less than 1
#> 95 percent confidence interval:
#>  0.0000000 0.8827118
#> sample estimates:
#> ratio of variances 
#>           0.277679
t.test(x-y) # check that x-y does not have an offset
#> 
#>  One Sample t-test
#> 
#> data:  x - y
#> t = -0.0098369, df = 9, p-value = 0.9924
#> alternative hypothesis: true mean is not equal to 0
#> 95 percent confidence interval:
#>  -0.1660619  0.1646239
#> sample estimates:
#>     mean of x 
#> -0.0007189834

Created on 2021-09-02 by the reprex package (v2.0.0)

I think it should be possible to extend this approach to test whether two time series are linearly correlated, using x-lm(x ~ y) instead of x-y.

Edit: Dealing with autocorrelation I think could be done by finding a suitable Effective Degrees of Freedom for the tests, c.f., https://doi.org/10.1016/j.neuroimage.2019.05.011

0

Fit a straight line to both the time series signals using polyfit. Then compute root-mean-square-error (RMSE) for both the lines. The obtained value for the red-line would be quite less than the one obtained for gray line.

Also make the readings on some common frequency.

  • 2
    Welcome to Cross Validated and thanks for your first answer! I am however concerned that you are not answering the question directly - how exactly would the proposed approach help the asker to asses whether the values and/or trends are similar? – Martin Modrák Mar 12 '18 at 09:49