3

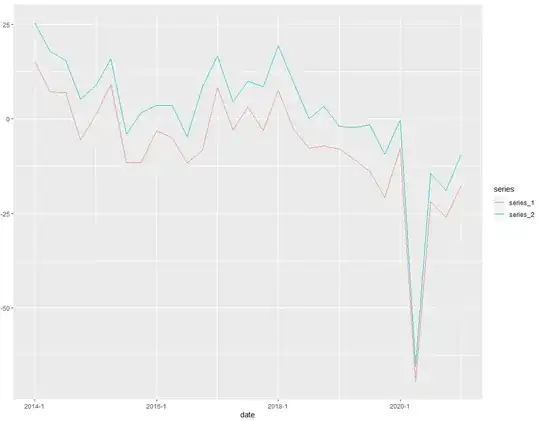
Every quarter, we ask around 2500 companies about their business situation. The possible answers are good (+1), normal (0) or bad (-1). The answers are, then, aggregated to an index (series_1) (The index corresponds to the simple arithmetic mean of all answers multiplied by a factor of 100). In additon, we calculated the same index for a subsector (series_2).

enter image description here

What I am trying to find out is which test I can use to test whether the two time series are statiscally different from each other.

Although I googled a lot, I could not find a statistical test to answer my question. So, any help is greatly appreciated.
Pitouille
  • 1,506
  • 3
  • 5
  • 16
rs_cit
  • 33
  • 3
  • 1
    This post seems very similar to what you are looking for... https://stats.stackexchange.com/questions/19103/how-to-statistically-compare-two-time-series – Pitouille Sep 02 '21 at 09:06

1 Answers1

1

Disclaimer: I am myself somewhat confused regarding time series, but in your case I don't think time-seriesness is a relevant feature.

If you plot your data not as two curves over time, but as a scatter plot, with values of one series on the $x$-axis and the corresponding (in time) values of the other on the $y$-axis, the points should lie more-or-less on a straight line: Where series 1 has a high value, series 2 is also high, and vice versa.

You are actually asking whether the two series measure the same "thing" (the same sentiment about the business situation). You can test that with Intraclass correlation.

Igor F.
  • 6,004
  • 1
  • 16
  • 41