I am working on GPS data and I have plotted the speed distribution across a time frame for 3 different moving objects. Data length is not the same for my 3 entities. i.e object 1 has 4500 rows and object 2 has 2700 for each attribute. moreover, time is in seconds, starting from the first measurement.
my code is as follows:
plot(object1$speed)
plot(object2$speed)
which gives me the following graphs:
[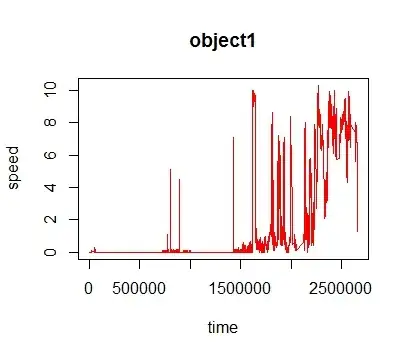 1
1
[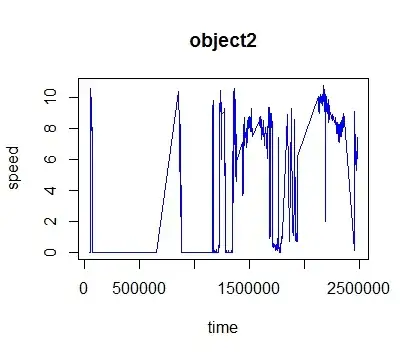 2
2
I am trying to find a way to compare them. that is measuring similarity. I am also trying to see if there is a similarity in some particular part of the distribution if not all. I do not want to correlate the distributions as this will give me just one value. I am trying to find similarities in all or part of the sequence. does anyone know how to do this?