147

My understanding is that $R^2$ cannot be negative as it is the square of R. However I ran a simple linear regression in SPSS with a single independent variable and a dependent variable. My SPSS output give me a negative value for $R^2$. If I was to calculate this by hand from R then $R^2$ would be positive. What has SPSS done to calculate this as negative?

R=-.395
R squared =-.156
B (un-standardized)=-1261.611

Code I've used:

DATASET ACTIVATE DataSet1. 
REGRESSION /MISSING LISTWISE /STATISTICS COEFF OUTS R ANOVA 
           /CRITERIA=PIN(.05) POUT(.10) /NOORIGIN 
           /DEPENDENT valueP /METHOD=ENTER ageP

I get a negative value. Can anyone explain what this means?

Negative RSquared

enter image description here

Ferdi
  • 4,882
  • 7
  • 42
  • 62
Anne
  • 1,967
  • 6
  • 17
  • 13
  • 3
    Does this answer your question? http://stats.stackexchange.com/questions/6181/can-the-multiple-linear-correlation-coefficient-be-negative If not, then please provide more information: this is the "SPSS output" of what procedure? – whuber Jul 11 '11 at 17:14
  • Thanks Whuber. Not it doesn't because there seems to be disagreement on whether or not R squared can be negative and I can't how it has calculated R squared as negative. I've edited the above. Please let me know if I need to add more details. Many thanks! – Anne Jul 11 '11 at 17:52
  • OK. However, you may have been hasty in your reading. The reply to that question by @probabilityislogic begins by saying R squared "cannot be negative," but later on it admits that indeed it "can go negative." Thus there isn't any disagreement. A clear moral is that you need to let us know what procedure is being used to calculate R squared. – whuber Jul 11 '11 at 17:52
  • 3
    Does your linear regression model have an intercept? – NPE Jul 11 '11 at 17:59
  • 3
    @Anne Again, **which SPSS procedure are you using?** – whuber Jul 11 '11 at 18:19
  • Yes, the constant is 137278.4. I am running a simple OLS regression in SPSS. Thanks! – Anne Jul 11 '11 at 18:49
  • The syntax is DATASET ACTIVATE DataSet1. REGRESSION /MISSING LISTWISE /STATISTICS COEFF OUTS R ANOVA /CRITERIA=PIN(.05) POUT(.10) /NOORIGIN /DEPENDENT pvalue /METHOD=ENTER age – Anne Jul 11 '11 at 18:51
  • Whuber, are you able to assist given this additional information? What I am still not clear on after looking at the answers at http://stats.stackexchange.com/questions/6181/can-the-multiple-linear-correlation-coefficient-be-negative is whether or not a negative R squared indicates there is something wrong with the model. The answer below appears to indicate that the model is distorted. – Anne Jul 11 '11 at 19:59
  • 1
    @Anne I suggest you disregard the time series reply, because your data are not time series and you're not using a time series procedure. Are you really sure the R squared is given as a negative value? Its magnitude is correct: $(-0.395)^2=0.156$. I have looked through SPSS help to see whether perhaps as a convention the R-squared value for negative R's is negated, but I don't see any evidence that this is the case. Perhaps you could post a screen shot of the output where you are reading the R-squared? – whuber Jul 11 '11 at 20:26
  • @Whuber, thanks. Yes, I am sure it gives a negative value. I have posted an image of the output. – Anne Jul 12 '11 at 03:12
  • @Anne, negative R-square in linear regression is indeed a strange finding. One needs to see your _data_. I recommend you to show it. If it's lengthy then leave a link to it here. – ttnphns Jul 12 '11 at 05:00
  • It seems you have found a bug, perhaps it would be best to contact SPSS customer support. There is nothing inherent in your code that would logically produce a negative R square value. – Andy W Jul 12 '11 at 12:30
  • I'm stumped too, but I would also answer Yes there is something wrong with your model, based on the astronomical-looking standard error of estimate. It indicates that a CI95 for a given predicted value would be the value +/- 120,000: doesn't that seem out of range given your dependent variable? – rolando2 Jul 12 '11 at 19:15
  • 1
    The dependent variable is price of houses so it is feasible that the 95% CI maybe 120,000. Unfortunately I cannot post the data here as it would be contrary to data use conditions. – Anne Jul 16 '11 at 05:26
  • 2
    @Anne There's nothing the matter with large standard errors: they merely reflect the units in which the dependent variable is measured. However, it is possible the strange results arise from numerical instabilities. Sometimes it helps to re-express the data in a way that reduces the potential effects of floating point error. In this case, the stats suggest you should compute y = (valueP - 100000)/1000 and try again to regress y against ageP. Do you still get a negative R square? – whuber Jul 18 '11 at 12:41
  • I encountered a similar problem when implementing a Least Squares solution in Python. The problem turned out to be a failure on my part to normalize the inputs to R2 when I had also normalized the inputs to the Least Squares method. The resulting negative R2 values where caused by the disparity between the larger real values of the original inputs versus the smaller normalized inputs. – jjh Jan 04 '15 at 22:22
  • If adj R square negative that means sample size less than number of parameters if increase sample size the matter would solve. – Shabir ahmad Feb 10 '16 at 06:50
  • I'm not sure that's the case, can anybody else confirms? – SmallChess Feb 15 '16 at 05:11
  • Sometime it's helpful to check the doc. I thought python `scipy.stats.lingress`'s `rvalue` was r-squared, it always gave me -ve values. – user3226167 Dec 11 '18 at 07:30

3 Answers3

183

$R^2$ compares the fit of the chosen model with that of a horizontal straight line (the null hypothesis). If the chosen model fits worse than a horizontal line, then $R^2$ is negative. Note that $R^2$ is not always the square of anything, so it can have a negative value without violating any rules of math. $R^2$ is negative only when the chosen model does not follow the trend of the data, so fits worse than a horizontal line.

Example: fit data to a linear regression model constrained so that the $Y$ intercept must equal $1500$.

enter image description here

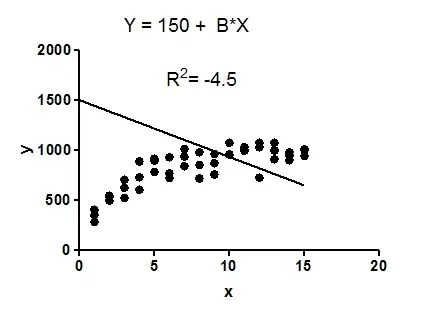
The model makes no sense at all given these data. It is clearly the wrong model, perhaps chosen by accident.

The fit of the model (a straight line constrained to go through the point (0,1500)) is worse than the fit of a horizontal line. Thus the sum-of-squares from the model $(SS_\text{res})$ is larger than the sum-of-squares from the horizontal line $(SS_\text{tot})$.

$R^2$ is computed as $1 - \frac{SS_\text{res}}{SS_\text{tot}}$. (here, $SS_{res}$ = residual error.)
When $SS_\text{res}$ is greater than $SS_\text{tot}$, that equation computes a negative value for $R^2$.

With linear regression with no constraints, $R^2$ must be positive (or zero) and equals the square of the correlation coefficient, $r$. A negative $R^2$ is only possible with linear regression when either the intercept or the slope are constrained so that the "best-fit" line (given the constraint) fits worse than a horizontal line. With nonlinear regression, the $R^2$ can be negative whenever the best-fit model (given the chosen equation, and its constraints, if any) fits the data worse than a horizontal line.

Bottom line: a negative $R^2$ is not a mathematical impossibility or the sign of a computer bug. It simply means that the chosen model (with its constraints) fits the data really poorly.

Harvey Motulsky
  • 14,903
  • 11
  • 51
  • 98
  • This is a nice illustration of the point made by @jefflovejapan. Where in the SPSS command is such a constraint specified? – whuber Jul 13 '11 at 15:48
  • @whuber I think /NOORIGIN sets the intercept to 0. – JMS Jul 13 '11 at 18:00
  • 4
    @JMS That's the opposite of what my Googling indicates: "/ORIGIN" fixes the intercept at 0; "/NOORIGIN" "tells SPSS not to suppress the constant" ([An Introductory Guide to SPSS for Windows](http://books.google.com/books?id=f7ogAII5QNMC&pg=PA106&lpg=PA106&dq=SPSS+/NOORIGIN&source=bl&ots=4QXqyYlcY4&sig=CzfM3P8ikTOeA-4MINNCpNv__NI&hl=en&ei=yt8dTsCEEpPTgQeZ9dngCQ&sa=X&oi=book_result&ct=result&resnum=1&ved=0CBUQ6AEwAA#v=onepage&q=SPSS%20%2FNOORIGIN&f=false)) – whuber Jul 13 '11 at 18:13
  • 18
    @whuber Correct. @harvey-motulsky A negative R^2 value **is** a mathematical impossibility (and suggests a computer bug) for regular OLS regression (with an intercept). This is what the 'REGRESSION' command does and what the original poster is asking about. Also, for OLS regression, R^2 **is** the squared correlation between the predicted and the observed values. Hence, it must be non-negative. For simple OLS regression with one predictor, this is equivalent to the squared correlation between the predictor and the dependent variable -- again, this must be non-negative. – Wolfgang Jul 14 '11 at 07:17
  • 1
    @whuber Indeed. My bad; obviously I don't use SPSS - or read, apparently :) – JMS Jul 14 '11 at 16:56
  • 1
    @whuber. I added a paragraph pointing out that with linear regression, R2 can be negative only when the intercept (or perhaps the slope) is constrained. With no constraints, the R2 must be positive and equals the square of r, the correlation coefficient. – Harvey Motulsky Jul 16 '11 at 15:55
  • 1
    @HarveyMotulsky, in this case the intercept or slope were not constrained. It seems that you are saying that Rsquared can only be negative if these are constrained. Can you elaborate on what might have occurred in this particular case? – Anne Jul 16 '11 at 21:56
  • @anne. With linear regression with no constraints, R2 cannot be negative. I can't understand why the results you show include a negative R2. It might help to include your data file and screen captures of all the SPSS options, so that others (who know SPSS well) can figure out what happened. – Harvey Motulsky Jul 18 '11 at 14:25
  • 2
    Why is it called $R^2$ if squaring is not necessarily involved? Also why is it involved sometimes but not others (does $R^2$ lack a consistent definition?)? – Joseph Garvin Jun 08 '19 at 04:01
  • PLEASE CLARIFY: are there different opposing definitions of R2? Wikipedia even has multiple definitions on the same page. Please START with the ONE TRUE DEFINITION. – mathtick Apr 02 '20 at 19:19
  • @JosephGarvin Wondering the same thing. – Ion Sme Mar 21 '21 at 00:11
  • @HarveyMotulsky you said "A negative $R^2$ is only possible with linear regression when either the intercept...". [This](https://stats.stackexchange.com/a/164702/328159) answer says: "In the model without an intercept ... $R^2$ can not be shown to be positive.". [This](https://stats.stackexchange.com/a/183279/328159) answer says "$R^2$ can be negative, it just means that: ... You did not set an intercept" Arent you saying opposite of those two answers? – Rnj Jul 16 '21 at 16:42
  • @Rnj Neither of the answers you link to were written by me. But maybe I can clarify a bit. If you fit a linear regression model "with no intercept", that means you are forcing the line to go through the origin (0.0). The wording is a bit confusing. "No intercept" means you set a constraint. If you do fit an intercept, then the regression algorithm decides where the line crosses the Y-axis. In this latter case, the R2 is always positive. When there is no intercept in the model, so you force the line through the origin, the R2 can be negative or positive. – Harvey Motulsky Jul 16 '21 at 22:22
  • Is the "horizontal straight line (the null hypothesis)" called the grand mean of the data? – Nate Dec 15 '21 at 15:33
  • 1
    @Nate. Yes, the null hypothesis of linear regression (with no constraints, and equal weighting of all points) is a straight line at Y = Mean – Harvey Motulsky Dec 16 '21 at 17:19
  • Cool, thank you! – Nate Dec 16 '21 at 19:03
26

Have you forgotten to include an intercept in your regression? I'm not familiar with SPSS code, but on page 21 of Hayashi's Econometrics:

If the regressors do not include a constant but (as some regression software packages do) you nevertheless calculate $R^2$ by the formula

$R^2=1-\frac{\sum_{i=1}^{n}e_i^2}{\sum_{i=1}^{n}(y_i-\bar{y})^2}$

then the $R^2$ can be negative. This is because, without the benefit of an intercept, the regression could do worse than the sample mean in terms of tracking the dependent variable (i.e., the numerator could be greater than the denominator).

I'd check and make sure that SPSS is including an intercept in your regression.

jefflovejapan
  • 563
  • 4
  • 12
8

This can happen if you have a time series that is N.i.i.d. and you construct an inappropriate ARIMA model of the form(0,1,0) which is a first difference random walk model with no drift then the variance (sum of squares - SSE ) of the residuals will be larger than the variance (sum of squares SSO) of the original series. Thus the equation 1-SSE/SSO will yield a negative number as SSE execeedS SSO . We have seen this when users simply fit an assumed model or use inadequate procedures to identify/form an appropriate ARIMA structure. The larger message IS that a model can distort (much like a pair of bad glasses ) your vision. Without having access to your data I would otherwise have a problem in explaining your faulty results. Have you brought this to the attention of IBM ?

The idea of an assumed model being counter-productive has been echoed by Harvey Motulsky. Great post Harvey !

IrishStat
  • 27,906
  • 5
  • 29
  • 55
  • 1
    stat. Thanks. No I have not spoken to IBM. The data is not time series. It is from point in time data. – Anne Jul 11 '11 at 19:55
  • 5
    @Anne and others: Since your data are not time series and you're not using a time series procedure please disregard my answer. Others who have observed negative R Squares when involved with time series might find my post interesting and tangentially informative. Others unfortunately may not. – IrishStat Jul 11 '11 at 21:36
  • @IrishStat: Could you please add a link to the Harvey Motulsky post? – kjetil b halvorsen Aug 27 '18 at 08:33
  • Harvey answered the question here. – IrishStat Aug 27 '18 at 09:22