Sankey diagrams are a specific type of flow diagram, in which the width of the arrows is proportional to the flow quantity.
Sankey diagrams are frequently used to depict voter movements between elections and similar flows.
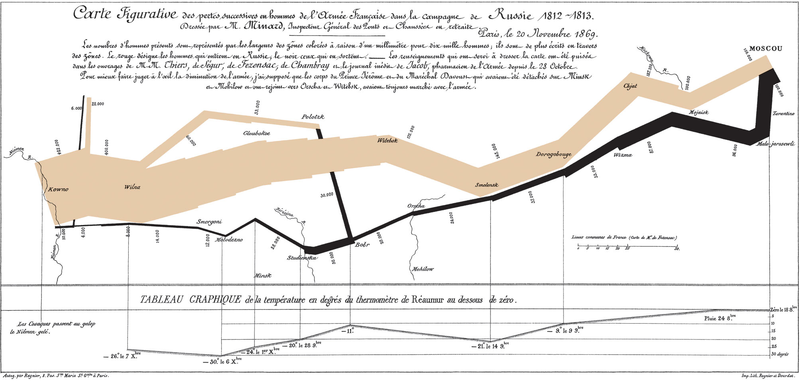
A Sankey diagram overlaid on a map, to show flows between geographical regions, is called a flow map. One famous example is Minard's flow map of Napoleon's Russian campaign, which actually predates Sankey's non-geographic diagrams.
The following thread discusses tools to create Sankey diagrams: What's a good tool to create Sankey diagrams?