3

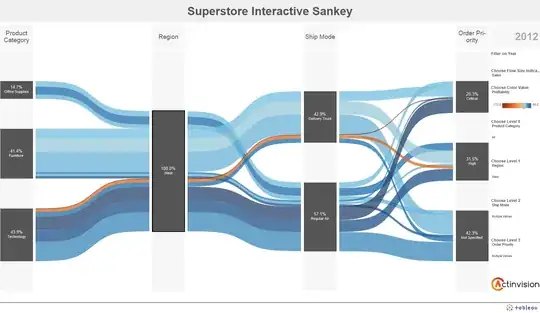
Sankey diagrams are helpful for visualizing multiple, interacting processes:

enter image description here

Are there any statistical tools available that can analyze the interactions of multiple processes? I'm aware of sequence analysis tools like TraMineR, but to my knowledge they cannot analyze interactions between multiple processes.

Stephan Kolassa
  • 95,027
  • 13
  • 197
  • 357
histelheim
  • 2,465
  • 4
  • 23
  • 40
  • You don't really have "interactions" except in the colloquial sense of the term. You just have a conditional multinomial at each stage. You can assess that with %'s & CI's. – gung - Reinstate Monica Nov 04 '15 at 03:18
  • @gung: Could you explain "conditional multinomial" in this context? – histelheim Nov 04 '15 at 03:19
  • 1
    Sure: `order priority` is a multinomial with proportions for `critical`, `high`, & `not specified`, given that you are, say, `regular air`. – gung - Reinstate Monica Nov 04 '15 at 03:32
  • 1
    What do you mean by "analyze"? You seem to be more interesting in visualizing your data. – Andrew Charneski Nov 04 '15 at 04:38
  • @AndrewCharneski: I'm not interested in visualizing, I'm interested in statistical analysis, as the question states. For example, I would love to understand how to get descriptive statistics, use patterns earlier on in the sankey diagram to predict patterns later on, and to use the overall descriptive statistics to predict outcome variables at the end of the process(es) – histelheim Nov 04 '15 at 15:35
  • The vagueness of the question (originating from broadness of this theme), shows how difficult it is to make (general) statistical tools that solve these kind of questions in a simple way. The tool should ask first 'what do you mean?' (with many answers possible). So, many people apply *custom* made software to solve these kind of problems. For specific problems there exist (often expensive) packages. For instance for process simulation in chemical engineering you have software from Aspen or Chemstations. There should be some ERP software that can help you with your superstore Sankey. – Sextus Empiricus Nov 06 '17 at 10:16
  • By the way, I would not use a Sankey diagram in the case of that Superstore image. The boxes seem more like classes than real physical entities (and you can better use a table or a hierarchical diagram). Ie, your products do not **flow** from, technology, to west, to delivery truck, to critical. In the image you have got a 3x1x2x3 factor design and *all* the data/information is already given in the color coding (3+6+6) of the left hand side. The spaghetti on the right hand side, between Ship mode and Order-Priority is not very helpful, and not what Sankey diagrams have been designed for. – Sextus Empiricus Nov 06 '17 at 10:32

1 Answers1

1

In the sequence analysis literature and methodology, formally describing and analyzing interacting processes is approached through the concept of multi-channel sequence analysis.

The basic idea is that something can transition between states in multiple "channels", and that these (non-)transitions in different channels interact. For instance, to understand employment trajectories, it is likely that state-transitions in the channel of family formation (single - cohabiting - married), the channel of housing (parents - renting - buying) and the labor market channel (studying - unemployed - employed) are related.

To incorporate this into sequence analysis, the idea of clustering various pasterns of state-transitions within a single channel on the basis of optimal matching-distances is extended to the multivariate case. For details see cited papers below.

TraMineR supports multi-channel sequence analysis through e.g. the function seqdistmc() (docs).


Gauthier, J., Widmer, E. Bucher P. & Notredame, C. (2010). Multichannel Sequence Analysis Applied to Social Science Data. Sociological Methodology, Vol 40, Issue 1.

Pollock, Gary (2007). Holistic trajectories: a study of combined employment, housing and family careers by using multiple-sequence analysis. Journal of the Royal Statistical Society: Series A 170, Part 1, 167–183.
mhermans
  • 168
  • 5