4

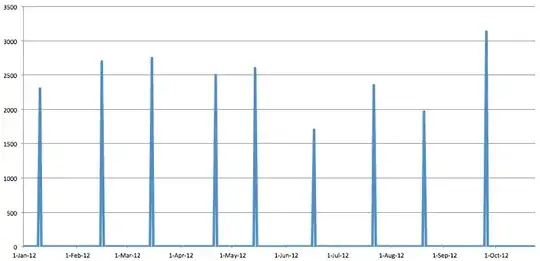
I have tried a number of different models to forecast the time series shown below, but so far I haven't found any models that satisfy me. I am looking for ideas for a suitable model.
enter image description here

The objective of the forecasting is two-fold:

  1. predicting the interval and thereby determining when the next peaks will happen.
  2. What will the volume (size of peak) be on the next occurrences.

The time series data behind the chart are below:

sampleTS <- structure(c(0L, 0L, 0L, 0L, 0L, 0L, 0L, 0L, 0L, 2300L, 0L, 0L, 
0L, 0L, 0L, 0L, 0L, 0L, 0L, 0L, 0L, 0L, 0L, 0L, 0L, 0L, 0L, 0L, 
0L, 2700L, 0L, 0L, 0L, 0L, 0L, 0L, 0L, 0L, 0L, 0L, 0L, 0L, 0L, 
0L, 0L, 0L, 0L, 0L, 0L, 0L, 0L, 0L, 0L, 0L, 0L, 0L, 0L, 0L, 2750L, 
0L, 0L, 0L, 0L, 0L, 0L, 0L, 0L, 0L, 0L, 0L, 0L, 0L, 0L, 0L, 0L, 
0L, 0L, 0L, 0L, 2500L, 0L, 0L, 0L, 0L, 0L, 0L, 0L, 0L, 0L, 0L, 
0L, 0L, 0L, 0L, 0L, 0L, 0L, 0L, 0L, 0L, 0L, 0L, 2600L, 0L, 0L, 
0L, 0L, 0L, 0L, 0L, 0L, 0L, 0L, 0L, 0L, 0L, 0L, 0L, 0L, 0L, 0L, 
0L, 0L, 0L, 0L, 0L, 0L, 0L, 0L, 0L, 0L, 0L, 0L, 0L, 0L, 0L, 1700L, 
0L, 0L, 0L, 0L, 0L, 0L, 0L, 0L, 0L, 0L, 0L, 0L, 0L, 0L, 0L, 0L, 
0L, 0L, 2356L, 0L, 0L, 0L, 0L, 0L, 0L, 0L, 0L, 0L, 0L, 0L, 0L, 
0L, 0L, 0L, 0L, 0L, 0L, 0L, 0L, 0L, 0L, 0L, 0L, 0L, 0L, 0L, 0L, 
1967L, 0L, 0L, 0L, 0L, 0L, 0L, 0L, 0L, 0L, 0L, 0L, 0L, 0L, 0L, 
0L, 0L, 0L, 0L, 0L, 0L, 0L, 0L, 0L, 0L, 0L, 0L, 0L, 0L, 0L, 0L, 
0L, 0L, 0L, 0L, 0L, 3130L, 0L, 0L, 0L, 0L, 0L, 0L, 0L, 0L, 0L, 
0L, 0L, 0L, 0L, 0L, 0L, 0L, 0L, 0L, 0L, 0L, 0L, 0L, 0L, 0L, 0L, 
0L, 0L, 0L), .Dim = c(297L, 1L), .Dimnames = list(NULL, "V1"), .Tsp = c(15340, 
15340.8109589041, 365), class = "ts")
Stephan Kolassa
  • 95,027
  • 13
  • 197
  • 357
Jochem
  • 215
  • 3
  • 11
  • What is your forecast cost function? How important it is for you to know the exact time of the burst? In other words what would be a good forecast? – Aksakal May 14 '14 at 17:33
  • @Aksakal: The exact time is more important than the exact volume. The data represent shipments and it is important to know when they are expecting to happen so plans can be made accordingly. – Jochem May 17 '14 at 18:49

2 Answers2

2

This is exactly what Croston's method for forecasting intermittent demand was created for. It exponentially smoothes inter-demand periods and demand amounts independently.

library(forecast)
model <- croston(sampleTS)
summary(model)

We see that Croston forecasts an inter-demand period of 22.79 days and a demand of 2388 units. Prediction intervals for the period and demand components (but not for the forecast of total mean demand) are included in the summary output, in spite of the help page saying that there are no prediction intervals since Croston's method as such is not based on a stochastic model. (I'll inform the package maintainer, this could be confusing.)

In fact, Croston's method is slightly biased. I don't know whether forecast::croston() includes the bias correction proposed by Syntetos & Boylan.

Stephan Kolassa
  • 95,027
  • 13
  • 197
  • 357
0

My forecast: 2500 every 15th of any given month. No amount of statistical wizardry can produce a forecast better than mine.

You have 9 data points, there's not much information in the data to play with.

Aksakal
  • 55,939
  • 5
  • 90
  • 176
  • This might hold for an error metric of mean absolute error. But what if the loss function is squared error or something else? – soakley Nov 12 '21 at 21:42
  • The sample is so small that you can do whatever you want and will not know how good is your forecast. – Aksakal Nov 12 '21 at 21:47