0

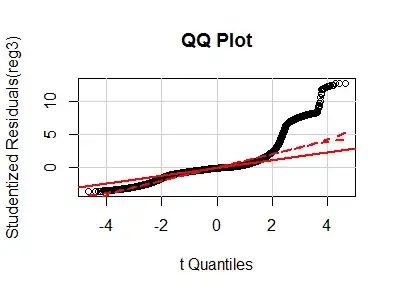
My Error's plot from a linear regression

enter image description here.

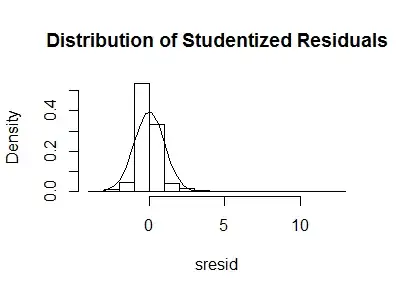
Is it Normal distributted? If not, why? What that negative big bar means?

The code used is:

  library(MASS)
sresid <- studres(reg3) 
hist(sresid, freq=FALSE, 
     main="Distribution of Studentized Residuals")
xfit<-seq(min(sresid),max(sresid),length=40) 
yfit<-dnorm(xfit) 
lines(xfit, yfit)

Edited:

enter image description here

user44400
  • 1
  • 2

1 Answers1

1

A histogram is not the best graph to do this. You are better of using a Q-Q plot, e.g. Regression - How do I know if my residuals are normally distributed?.

If you do that, I suspect you will see that an important deviation from normality/Gaussianity is that the residuals are right-skewed.

Maarten Buis
  • 19,189
  • 29
  • 59