Performing a regression and need to find out if my residuals are normally distributed.
Asked
Active
Viewed 3.0k times
8
-
Take a look here as well http://stats.stackexchange.com/questions/58941/ncvtest-from-r-and-interpretation – MCP_infiltrator May 02 '14 at 14:04
3 Answers
15
In practice you simply don't know (but they probably aren't). Not that non-normal residuals are necessarily a problem; it depends on how non-normal and how big your sample size is and how much you care about the impact on your inference.
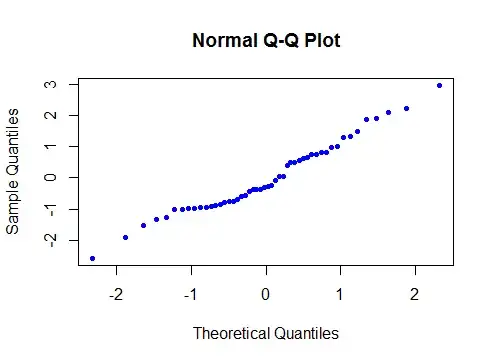
You can see if the residuals are reasonably close to normal via a Q-Q plot.
A Q-Q plot isn't hard to generate in Excel.
If you take $r$ to be the ranks of the residuals (1 for smallest, 2 for second smallest, etc), then
$\Phi^{-1}(\frac{r-3/8}{n+1/4})$ is a good approximation for the expected normal order statistics. Plot the residuals against that transformation of their ranks, and it should look roughly like a straight line.
(where $\Phi^{-1}$ is the inverse cdf of a standard normal)
If you haven't used Q-Q plots before, I'd suggest generating a bunch of sets of random normal data (at several samples sizes) and seeing what the plots look like. (Roughly like points close to a straight line with some tendency to be a bit more noisy - wiggle a bit - at the ends)
Then generate skewed data, heavy tailed data, uniform data, bimodal data etc and see what the plots look like when data isn't normal. (Various kinds of curves and kinks, basically)
These plots are standard in most stats packages.
Here's one done in R:
Here's one I just generated in Excel via the above method:
(not the same set of data both times)
You can see the points form a straightish line ... that's because the data was actually normal.
Here's one that's not normal (it's quite right skew):
If you ever happen to be using something that has neither Q-Q plots nor inverse normal cdf functions, proceed as above up to the ranking stage, then find $p=\frac{r-3/8}{n+1/4}$ but use the Tukey lambda approximation to the inverse normal cdf.
Actually, there are two such that have been in popular use:
$\Phi^{-1}(p) \approx 5.05 (p^{0.135} - (1-p)^{0.135})$
$\Phi^{-1}(p) \approx 4.91 (p^{0.14} - (1-p)^{0.14})$
(Either is quite adequate, but my recollection is that the second seemed to work slightly better. I believe Tukey used 1/0.1975 = 5.063 in the first one instead of 5.05)
Glen_b
- 257,508
- 32
- 553
- 939
8
Using plots of simulated data to get an impression of how to interpret a Q-Q plot as propsed by @Glen_b is an excelent idea.
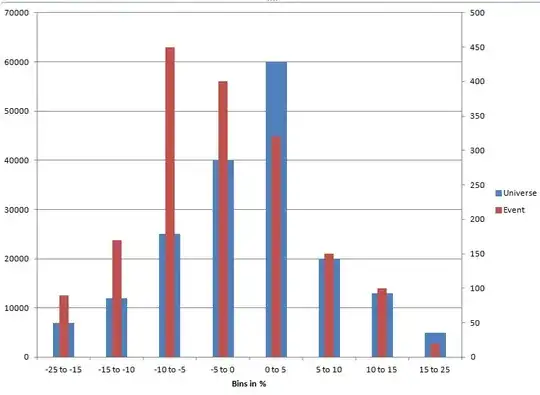
You can also use such simulated curves as a background in your final graph. That way it is easier to compare the diviations from the diagonal in your observed residuals with the kind of variation from the diagonal line one could expect when the residuals were draws from a real normal distribution. See for example the graph below:

The details:
I made this graph in Stata. For convenience I used for the plotting position $p=\frac{r-.5}{n}$, the default for qplot. For those who have Stata and whish to play with it, here is the code (it requires the user written components qplot and the lean1 scheme, both can be found using findit):
// make sure the random draws can be replicated
set seed 12345

// load some data
sysuse auto, clear

// do a regression
reg price mpg foreign i.rep78

// predict the residuals
predict resid, resid

// create 19 random draws
forvalues i = 1/19 {
    gen resid`i' = rnormal(0,e(rmse))
}

//create the Q-Q plot
qplot resid? resid?? resid, trscale(invnorm(@)*e(rmse)) ///
    lcolor( `: display _dup(19) "gs12 "' black)         ///
    msymbol(`: display _dup(19) "none "' oh   )         ///
    connect(`: display _dup(19) "l "'    .    )         ///
    lpattern(solid...)                                  ///
    legend(order(20 "observed" 19 "simulated" )         ///
           subtitle(residuals))                         ///
    aspect(1) scheme(lean1)
Maarten Buis
- 19,189
- 29
- 59
1
There are normality tests, such as Jarque-Bera test, you can find them in any statistical package.
There was a bunch of comments recommending you not to test for normality. I agree that you don't have to test for normality if you don't use this assumption. However, if you use normality assumption then you better demonstrate that it holds. In some regulated industries you must produce the evidence that your assumptions, such as normality, holds.
Aksakal
- 55,939
- 5
- 90
- 176
-
4It is true that there are tests for normality, but whether they constitute the best strategy is controversial, see: [Is normality testing 'essentially useless'?](http://stats.stackexchange.com/q/2492/7290) – gung - Reinstate Monica May 02 '14 at 14:06
-
This is as controversial as we make it. If you don't test the normality assumption, then you can't use it to test hypotheses. – Aksakal May 02 '14 at 14:34
-
6What @gung might be getting at in the reference to "strategy" is that in most applications a formal test of normality of residuals is both overkill and of little use, because the residuals usually do *not* have to pass a test of normality (and likely won't), but it is desirable that they exhibit a set of qualitative behaviors related to (approximate) lack of heteroscedasticity and lack of serial correlation. Usually, examination of residuals is a *diagnostic* and *exploratory* exercise rather than the confirmatory exercise suggested by this recommendation to apply a test. – whuber May 02 '14 at 15:25
-
It's not an overkill to spend 5 minutes running JB test. You already got the residuals. If you don't test normality, then you can't use normality for hypothesis testing. In such a case you have to use other means of testing hypotheses which are usually much more involved. So testing for normality may save you a lot of time. – Aksakal May 02 '14 at 15:31
-
3The point is that if you have enough observations (say > 100) normality/Gaussianity just isn't an issue. A second point is that there are many normality tests, and the JB test is about the worst, even worse then the Kolmogorov-Smirnov test. With bad I mean that the $p$-values don't mean what they should mean in a statistical test. for a simulation showing this, see [here](http://www.maartenbuis.nl/software/asl_norm.html). One normality test that performs fairly well is the Doornik-Hansen, but there are others. – Maarten Buis May 02 '14 at 15:45
-
@MaartenBuis, you made baseless statements about JB and KS tests for normality. I challenge you to produce the reference to support them. [Thode's findings](http://books.google.com/books/about/Testing_For_Normality.html?id=gbegXB4SdosC) are opposite to your claims, there's a bunch of papers out there not recommending usage of KS test for normality. – Aksakal May 02 '14 at 15:54
-
2He isn't recommending the KS test. My comment above was rather sparse, but all of the points are discussed in the thread I linked to. You should read that to see what we mean here. – gung - Reinstate Monica May 02 '14 at 15:56
-
@Aksakal just try it out. Do a simulation and you'll see how horrible the JB-test performs. Other tests are available that perform much better, e.g. the Doornik-Hansen test I mentioned above. – Maarten Buis May 03 '14 at 12:55
-
That leaves the main point, that if you have enough observations, you don't need the residuals to be normally distributed. [Here](http://www.talkstats.com/showthread.php/55216-Normal-distribution?p=155817&highlight=#post155817) is an example of a simulation showing just that. – Maarten Buis May 03 '14 at 12:58
-
@MaartenBuis, power of a test comparison is not something you can do in 5 minutes. People spend a lot of time on this type of stuff, it makes a sense to use their results. – Aksakal May 03 '14 at 13:58
-
@Aksakal, lack of power is not the issue with JB that I was referring to. The problem is that the test relies on asymptotic results that don't kick in untill the sample size gets extremely large ($\gg 10^6$), which means that in smaller samples, the $p$-values don't mean what they should mean. The intuition is discussed [here](http://www.stata.com/statalist/archive/2012-09/msg01013.html). – Maarten Buis May 04 '14 at 07:54
-
@MaartenBuis, your reference is not the peer reviewed research. It doesn't mean that it's bad, of course. Whoever wrote it should try to publish it and see if it goes through. The peer reviewed literature would suggest JB test as one of the better ones. – Aksakal May 04 '14 at 14:16
-
1My guess of why @NickCox did not publish this result is that these results were already well known in the literature, even _before_ Jarque and Bera proposed their test. You can find the literature references in the WikiPedia entry you linked to in your original answer. – Maarten Buis May 05 '14 at 07:12