18

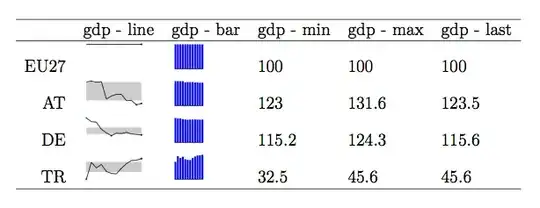
I would like to use R to plot out something like this:

Something like this

It would seem possible but highly complex to keep track of the coordinates, width, height, etc. Intuitively it would seem best to treat each cell as a new plot and transform the coordinates for each cell. Is there a way to do this in R?

thanks!

Ming K
  • 1,046
  • 7
  • 22
  • 9
    You are looking for [sparklines](http://en.wikipedia.org/wiki/Sparkline). Searching in R for `??sparkline` shows that the packages `sparkTable` and `YaleToolkit` could be helpful. – Bernd Weiss Mar 13 '11 at 19:26
  • Looking at `YaleToolkit`, appears they are using the `grid` package to create stacked sparklines. Perhaps I can use `grid` to create the table. – Ming K Mar 13 '11 at 19:52
  • 1
    I'm a bit late to the party on this one, but I recently had a similar question which has been answered over here with some alternative methods for standalone sparklines: [http://stackoverflow.com/questions/8337980/r-yaletoolkit-how-to-change-the-font-size-of-tick-labels-on-the-sparklines](http://stackoverflow.com/questions/8337980/r-yaletoolkit-how-to-change-the-font-size-of-tick-labels-on-the-sparklines) – Ben Dec 02 '11 at 09:16
  • Check `??sparkline` and [formattable](http://www.magesblog.com/2016/01/formatting-table-output-in-r.html) will helps. – Rγσ ξηg Lιαη Ημ Jan 24 '16 at 15:15

1 Answers1

22

I initially managed to produce something approaching your original picture with some quick and dirty R code (see this gist), until I discovered that the sparkTable package should do this very much better, provided you are willing to use $\LaTeX$. (In the meantime, it has also been pointed out by @Bernd!)

Here is an example, from help(sparkEPS):

enter image description here

It should not be too difficult to arrange this the way you want.

chl
  • 50,972
  • 18
  • 205
  • 364