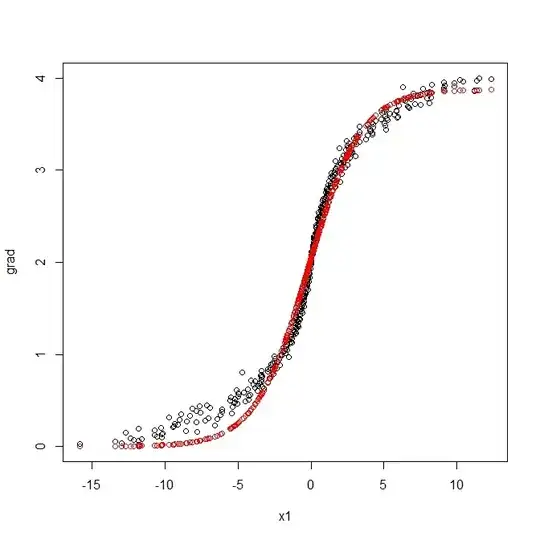
I tried to fit a curve to the black points using the following code. Why is the fit so bad? Do I need to fit another type of function?
fit <- nls(grad ~ theta1/(1 + exp(-(theta2 + theta3*x1))),
           start=list(theta1 = 4, theta2 = 0.09, theta3 = 0.31), trace=TRUE)

p = predict(fit)

plot(x1, grad)
points(x1, p, col = "red")