28

How can I sample from a mixture distribution, and in particular a mixture of Normal distributions in R? For example, if I wanted to sample from:

$$ 0.3\!\times\mathcal{N}(0,1)\; + \;0.5\!\times\mathcal{N}(10,1)\; + \;0.2\!\times\mathcal{N}(3,.1) $$

how could I do that?

gung - Reinstate Monica
  • 132,789
  • 81
  • 357
  • 650
  • 5
    I really don't like this way of denoting a mixture. I know it's conventionally done like this but I find it misleading.The notation suggests that to sample, you need to sample all three normals and weigh the results by those coefficients which would obviously not be correct. Anyone know a better notation? – StijnDeVuyst May 28 '16 at 19:14
  • 1
    I never got that impression. I think of the distributions (in this case the three normal distributions) as functions and then the result is another function. – roundsquare Oct 12 '19 at 20:13
  • @StijnDeVuyst you might want to visit this question originated from your comment : https://stats.stackexchange.com/questions/431171/why-is-weighing-random-observations-according-to-their-probability-from-all-dist –  Oct 12 '19 at 20:25
  • @ankii: thanks for pointing that out! – StijnDeVuyst Oct 14 '19 at 15:51
  • How can i calculate the following for the above mentioned mixture distribution?: 1. ninety-five percent HPD credible interval and 2. ninety-five percent equal-tail credible interval Thank you. – fx991ex_wiz Mar 13 '21 at 06:50

4 Answers4

41

It's good practice to avoid for loops in R for performance reasons. An alternative solution which exploits the fact rnorm is vectorized:

N <- 100000

components <- sample(1:3,prob=c(0.3,0.5,0.2),size=N,replace=TRUE)
mus <- c(0,10,3)
sds <- sqrt(c(1,1,0.1))

samples <- rnorm(n=N,mean=mus[components],sd=sds[components])
M. Berk
  • 2,485
  • 1
  • 13
  • 19
26

In general, one of the easiest ways to sample from a mixture distribution is the following:

Algorithm Steps

1) Generate a random variable $U\sim\text{Uniform}(0,1)$

2) If $U\in\left[\sum_{i=1}^kp_{k},\sum_{i=1}^{k+1}p_{k+1}\right)$ interval, where $p_{k}$ correspond to the the probability of the $k^{th}$ component of the mixture model, then generate from thedistribution of the $k^{th}$ component

3) Repeat steps 1) and 2) until you have the desired amount of samples from the mixture distribution

Now using the general algorithm given above, you could sample from your example mixture of normals by using the following R code:

#The number of samples from the mixture distribution
N = 100000                 

#Sample N random uniforms U
U =runif(N)

#Variable to store the samples from the mixture distribution                                             
rand.samples = rep(NA,N)

#Sampling from the mixture
for(i in 1:N){
    if(U[i]<.3){
        rand.samples[i] = rnorm(1,0,1)
    }else if(U[i]<.8){
        rand.samples[i] = rnorm(1,10,1)
    }else{
        rand.samples[i] = rnorm(1,3,.1)
    }
}

#Density plot of the random samples
plot(density(rand.samples),main="Density Estimate of the Mixture Model")

#Plotting the true density as a sanity check
x = seq(-20,20,.1)
truth = .3*dnorm(x,0,1) + .5*dnorm(x,10,1) + .2*dnorm(x,3,.1)
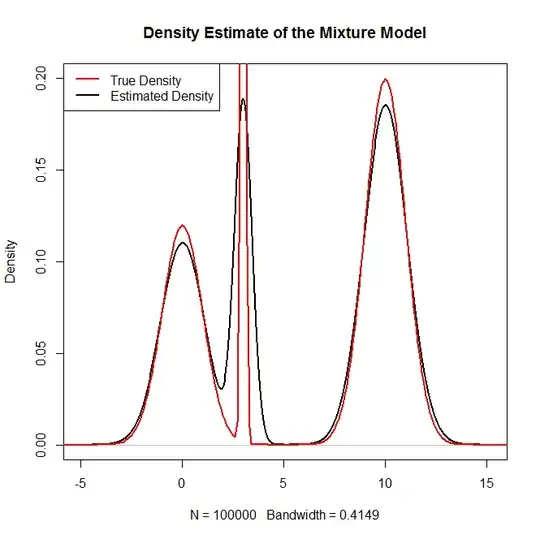
plot(density(rand.samples),main="Density Estimate of the Mixture Model",ylim=c(0,.2),lwd=2)
lines(x,truth,col="red",lwd=2)

legend("topleft",c("True Density","Estimated Density"),col=c("red","black"),lwd=2)

Which generates:

enter image description here

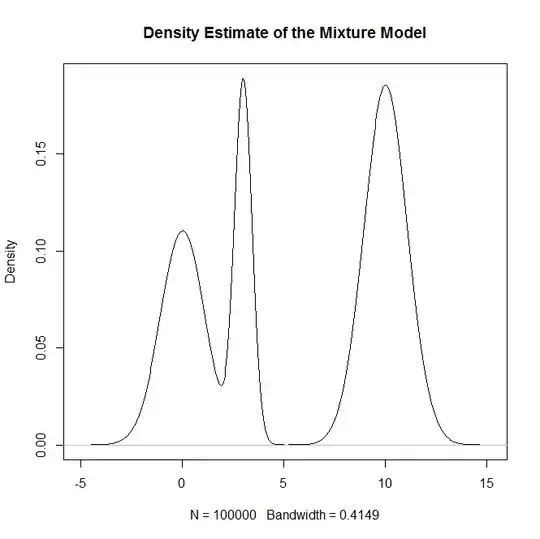
and as a sanity check:

enter image description here

  • Hi! Thanks so much! This answer helped me greatly. I am using this in a research project. I wish to quote a reference for the above. Can you please suggest a research article citation. – Abhishek Bhatia Jun 29 '15 at 11:24
8

Conceptually, you are just picking one distribution (from $k$ possibilities) with some probability, and then generating pseudo-random variates from that distribution. In R, this would be (e.g.):

set.seed(8)               # this makes the example reproducible
N     = 1000              # this is how many data you want
probs = c(.3,.8)          # these are *cumulative* probabilities; since they 
                          #   necessarily sum to 1, the last would be redundant
dists = runif(N)          # here I'm generating random variates from a uniform
                          #   to select the relevant distribution

# this is where the actual data are generated, it's just some if->then
#   statements, followed by the normal distributions you were interested in
data = vector(length=N)
for(i in 1:N){
  if(dists[i]<probs[1]){
    data[i] = rnorm(1, mean=0, sd=1)
  } else if(dists[i]<probs[2]){
    data[i] = rnorm(1, mean=10, sd=1)
  } else {
    data[i] = rnorm(1, mean=3, sd=.1)
  }
}

# here are a couple of ways of looking at the results
summary(data)
#    Min. 1st Qu.  Median    Mean 3rd Qu.    Max. 
# -3.2820  0.8443  3.1910  5.5350 10.0700 13.1600 

plot(density(data))

enter image description here

gung - Reinstate Monica
  • 132,789
  • 81
  • 357
  • 650
  • Nice answer, you beat me to posting :P –  Sep 24 '13 at 01:23
  • I am not sure where it is but there is an error in your code somewhere. Try running your code with N set to be much larger (for example N = 1000000) and you will see that the your density plot cannot be right because the components of the Gaussian will not be centered at the correct spots. –  Sep 24 '13 at 02:19
  • 1
    Thanks for the tip, @BabakP. I'm not sure what it was. It was something in the `ifelse()` statement, but I'll have to figure it out later. I replaced that code w/ a loop. – gung - Reinstate Monica Sep 24 '13 at 02:32
  • 6
    (cc @BabakP) These are both good answers and are obviously correct (+1s). Just an `R` programming trick: you can also use the `findInterval()` and `cumsum()` commands to simplify the code and, more importantly, make it easier to generalize to a different number of dimensions. For example, for an input vector of means $\mu$ (`mu`) and variances $\sigma^2$(`s`), and mixture probabilities (`p`), a simple function to generate n samples from this mixture would be `mix – Macro Sep 24 '13 at 03:19
  • 1
    @Macro, very true and very nice code! I have not seen the `findInterval()` command before, however, I like to write code on here as simplistically as I can because I want it to be a tool for understanding rather than efficiency. –  Sep 24 '13 at 03:22
  • @Macro, I agree w/ BabakP here in both respects. I generally try to write R code for CV w/ the idea in mind that it would (optimally) be readable by someone who's never seen R code before (of course, there's a question of whether that's possible, but that's the goal). – gung - Reinstate Monica Sep 24 '13 at 03:38
  • 2
    I said these were good answers. My purpose was not to criticize you but to offer an approach that easily generalizes to more than three dimensions by only changing a single argument, not any code. It's not clear to me why what you've written is any more transparent than what I've written but I surely don't want to argue about that. Cheers. – Macro Sep 24 '13 at 03:54
  • @Macro, I didn't mean my comment as a criticism or as argumentative, & I didn't take offense at your suggested code. I was simple explaining why I write the kind of non-terse code that I do on CV. – gung - Reinstate Monica Sep 24 '13 at 03:58
  • @Macro, neither did I. –  Sep 24 '13 at 04:07
  • @gung. +1 very nice answer. how do you determine `probs = c(.3,.8)`? I mean, in general, how do you figure out which component of the mixture should be used? Why not using equal probabilities? – Antoine Jun 07 '15 at 10:28
  • @gung please consider this [thread](http://stats.stackexchange.com/questions/155867/simulate-from-a-dynamic-mixture-of-distributions) – Antoine Jun 07 '15 at 13:14
  • @user2835597, the mixing proportions in the OP's problem statement are `.3, .5, .2`. Thus, the cumulative probabilities are `.3, .8, 1.0`. Ie, I didn't use equal probabilities, b/c the OP asked about these particular probabilities. When you run the code to generate a single (pseudo)random variate, the code first draws a number from a uniform distribution, if it is >.3, the 1st component is used, if it is >=.3 & <.8 component="" is="" last="" otherwise="" the="" used="" used.=""> – gung - Reinstate Monica Jun 08 '15 at 01:30
4

Already given perfect answers, so for those who want to achieve this in Python, here is my solution:

import numpy as np
import matplotlib.pyplot as plt
%matplotlib inline

mu = [0, 10, 3]
sigma = [1, 1, 1]
p_i = [0.3, 0.5, 0.2]
n = 10000

x = []
for i in range(n):
    z_i = np.argmax(np.random.multinomial(1, p_i))
    x_i = np.random.normal(mu[z_i], sigma[z_i])
    x.append(x_i)

def univariate_normal(x, mean, variance):
    """pdf of the univariate normal distribution."""
    return ((1. / np.sqrt(2 * np.pi * variance)) * 
            np.exp(-(x - mean)**2 / (2 * variance)))

a = np.arange(-7, 18, 0.01)
y = p_i[0] * univariate_normal(a, mean=mu[0], variance=sigma[0]**2) + p_i[1] * univariate_normal(a, mean=mu[1], variance=sigma[0]**2)+ p_i[2] * univariate_normal(a, mean=mu[2], variance=sigma[0]**2)

fig, ax = plt.subplots(figsize=(8, 4))

ax.hist(x, bins=100, density=True)
ax.plot(a, y)

enter image description here

ARAT
  • 620
  • 1
  • 7
  • 23