6

I have a largish data set (400,000 variables of 1000 samples). I would like to identify what is the best set of these variables for capturing most of the variance between samples.

What's the best way to perform an iterative principal component analysis that will perhaps go through X rounds of between Y and Z variables each time and result in a list of which round leads to the fewest number of PCs to capture a certain percentage of variance?

cianius
  • 255
  • 3
  • 9
  • I don't quite understand what you mean by "go through X rounds of between Y and Z variables". Are you talking about choosing Y out of the 4e5 variables? If so, does your knowledge about the application and the data suggest that you have a number of information carrying variables between noise-only variables or do you expect your data to have the information rather spread out over the variables? – cbeleites unhappy with SX Jun 30 '13 at 15:16
  • Yes, I meant I want to choose Y from the variables. I shouldn't need all 400000 to get an accurate enough picture. The information is spread out, with some being only noise as you said but some being very important. – cianius Jun 30 '13 at 15:26

2 Answers2

6

As I understand your problem, the main issue is the size of the data set, and not that it contains missing value (i.e. "sparse"). For such a problem, I would recommend doing a partial PCA in order to solve for a subset of leading PCs. The package irlba allows for this by performing a "Lanczos bidiagonalization". It is much faster for large matrices when you are only interested in returning a few of the leading PCs. In the following example, I have adapted a bootstrapping technique that I discussed here into a function that incorporates this method as well as a variable sub-sampling parameter. In the function bootpca, you can define the number of variables to sample, n, the number of PCs to return, npc, and the number of iterations B for the sub-sampling routine. For this method, I have centered and scaled the sub-sampled matrix in order to standardize the variance of the dataset and allow for comparability among the singular values of the matrix decomposition. By making a boxplot of these bootstrapped singular values, lam, you should be able to differentiate between PCs that carry signals from those that are dominated by noise.

Example

Generate data

m=50
n=100

x <- (seq(m)*2*pi)/m
t <- (seq(n)*2*pi)/n

#field
Xt <- 
 outer(sin(x), sin(t)) + 
 outer(sin(2.1*x), sin(2.1*t)) + 
 outer(sin(3.1*x), sin(3.1*t)) +
 outer(tanh(x), cos(t)) + 
 outer(tanh(2*x), cos(2.1*t)) + 
 outer(tanh(4*x), cos(0.1*t)) + 
 outer(tanh(2.4*x), cos(1.1*t)) + 
 tanh(outer(x, t, FUN="+")) + 
 tanh(outer(x, 2*t, FUN="+"))

Xt <- t(Xt)
image(Xt)

#Noisy field
set.seed(1)
RAND <- matrix(runif(length(Xt), min=-1, max=1), nrow=nrow(Xt), ncol=ncol(Xt))
R <- RAND * 0.2 * Xt

#True field + Noise field
Xp <- Xt + R
image(Xp)

load bootpca function

library(irlba)

bootpca <- function(mat, n=0.5*nrow(mat), npc=10, B=40*nrow(mat)){
  lam <- matrix(NaN, nrow=npc, ncol=B)
  for(b in seq(B)){
    samp.b <- NaN*seq(n)
    for(i in seq(n)){
        samp.b[i] <- sample(nrow(mat), 1)
    }
    mat.b <- scale(mat[samp.b,], center=TRUE, scale=TRUE)
    E.b  <- irlba(mat.b, nu=npc, nv=npc)
    lam[,b] <- E.b$d
    print(paste(round(b/B*100), "%", " completed", sep=""))
  }
  lam   
}

Result and plot

res <- bootpca(Xp, n=0.5*nrow(Xp), npc=15, B=999) #50% of variables used in each iteration, 15 PCs computed, and 999 iterations

par(mar=c(4,4,1,1))
boxplot(t(res), log="y", col=8, outpch="", ylab="Lambda [log-scale]")

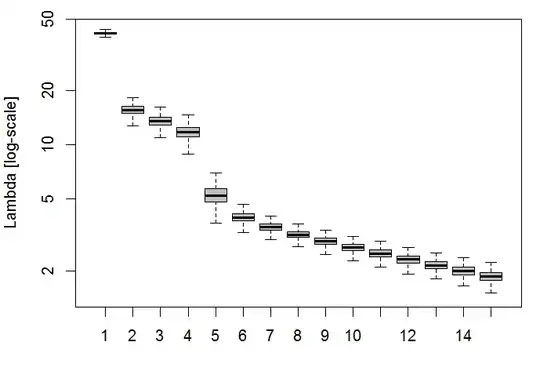
It's obvious that the leading 5 PCs carry the most information, although there were technically 9 signals in the example data set.

For your very large data set, you may want to use a smaller fraction of variables (i.e. rows) in each iteration, but do many iterations.

Marc in the box
  • 3,532
  • 3
  • 33
  • 47
  • When I try run this it says "iter not found". In your bootpca function is it just ncol(matrix)?Similarly, what is "Xp"? – cianius Jul 02 '13 at 10:24
  • @pepsimax - sorry about that. I have fixed the code - should work now. – Marc in the box Jul 02 '13 at 12:00
  • I have also added a "noisy" version of the original data matrix `Xp`, as I think its use in the example is more realistic. – Marc in the box Jul 02 '13 at 12:06
  • `irlba` is just a doing a matrix decomposition similar to `svd`, and thus this information is not really relevant for the function. It would essentially just change where your PCA loadings are located (in `$u` or `$v`). In this example, columns were treated as samples in order to center and scale the data with the `scale` function. This is probably not the right approach if your variables are different parameters. Can you describe what type of parameters you have? – Marc in the box Jul 02 '13 at 12:31
  • I have Genetic Sequencing data (genotypes) from about 1000 samples. Your code is a great help, but it doesn't tell. Or am I missing something simple? – cianius Jul 02 '13 at 13:28
  • Can you clarify "doesn't tell"? – Marc in the box Jul 02 '13 at 13:33
  • Sorry, accidentally deleted that bit. I meant that I want to know which iteration produced the fewest number of PCs required to explain a certain percentage of variance? I want to end up with a subset of the variables used so I can discard the rest to increase computational efficiency. – cianius Jul 02 '13 at 14:34
  • let us [continue this discussion in chat](http://chat.stackexchange.com/rooms/9496/discussion-between-pepsimax-and-marc-in-the-box) – cianius Jul 02 '13 at 15:23
2

Why don't you directly do a PCA on the full set and see where it takes you? PCA is computationally very fast, and you will be able to quickly to determine how many variables seem to be important for the first few components. I have been successful with that number of variables (albeit on a smaller sample size).

Alternatively, you can try an approach like regularized PCA or sparse PCA. If you are using R, take a look at the packages "elasticnet" and "mixOmics".

January
  • 6,999
  • 1
  • 32
  • 55