6

I would like to inquire about a simple test I might be able to perform to determine how 'nicely Gaussian' my empirical data are. If they are 'nicely Gaussian', then I can perform some other analysis, that assumes my data are Gaussian to begin with.

I am looking for a concrete test. I have a simple 1-dimensional data vector, with $N\approx 10,000$, so I have plenty of data. I want to determine if these data are Gaussian.

What I have tried:

  1. I understand that the Gaussian PDF has no skewness, and no kurtosis, so I have implemented those metrics and taken a measure. This works OK--I think--so as it stands, this is my plan B. Perhaps there is a better way?

  2. I have heard the term "chi-squared" being thrown around. I understand that it is a PDF in its own right, but I am not sure how this might apply to this problem.

  3. Although half in jest, my current way is to simply eyeball the data. Needless to say, this is OK for some cases, but it will not work when data is being run and I am sleeping...

EDIT:

It has been suggested that I talk some more about the 'other analysis' I had in mind, so here goes: If my data is Gaussian, I can readily apply a threshold developed (ex, here), but they only apply for data that is Gaussian. Now, if my test comes back "not Gaussian", then what I would like to do is determine what is the closest PDF that matches it, so that I can attempt to derive thresholds myself.

Now, thanks to everyone, I understand that there is an infinite number of PDFs, and I realize my question might have been somewhat open ended.

So to put a lot more clarity into the picture, I can say that my data is either a 'nice Gaussian' looking PDF, or, it tends to be a "Gaussian PDF with symmetric long tails". So, if my test comes back and says "Yes, your data is Gaussian", I can use one of the canned threshold tests I linked to earlier. If on the other hand my test says "No, the tails are way too long for a typical Gaussian...", then I would want to: 1) Know what type of PDF is this, 2) Estimate new thresholds on my own based on this.

I hope this clarifies some more, thanks for everyone.

Comp_Warrior
  • 2,075
  • 1
  • 20
  • 35
Creatron
  • 1,407
  • 2
  • 13
  • 23
  • 1
    You should look into the Kolmogorov Smirnov test. It is the most commonly used procedure to test whether empirical data follows a given distribution. – caburke Jun 21 '13 at 17:41
  • I think what you do is quite sensible. Given you skewness and kurtosis appear "reasonable" (ie. within some conf. intervals you calculate based on your sample size) showing those along-side a non-pathological QQ-plot would be adequate to show your data is Gaussian. *Overkill suggestion*: I guess you could go ahead and do quantile renormalization of your data ie. map your data quantiles on Gaussian quantiles. Then you would go ahead, and compare your two set quantiles using KS-test (mapped & unmapped); if they are significantly different, then you didn't have Gaussian data to start with. – usεr11852 Jun 21 '13 at 17:42
  • @caburke Thanks for that. [Kolmogorov Test](http://en.wikipedia.org/wiki/Kolmogorov%E2%80%93Smirnov_test). From quickly skimming, it would then seem that this test is a measure of the L-1 norm deviation of the CDFs? Is that it in a nutshell? – Creatron Jun 21 '13 at 17:48
  • @caburke: I never really felt comfortable with single normality test like Kolmogorov-Smirnov, Jarque–Bera, Shapiro-Wilk test etc (apparently it takes two to make a good Gaussianity test). I always find them "slightly too strong", as in my first comment, I find them a bit of an overkill. :TheGrapeBeyond: Basically yes. – usεr11852 Jun 21 '13 at 17:50
  • @user11852 Thank you. Yes, I would be content with just having a rough&tumble-then-go-home measure of goodness measure. Its not a HUGE deal if it is not completely fitting a gaussian, I just have to verify that it can be reasonably considered a gaussian... – Creatron Jun 21 '13 at 17:50
  • @TheGrapeBeyond: It is closer to $L_{\infty}$ really than $L_1$ but yeah that's the big picture. (I can't edit a comment after 5'...) – usεr11852 Jun 21 '13 at 17:57
  • @user11852 Oops! Yes thats what I meant - $L_{\infty}$. (Mini-max). :-) – Creatron Jun 21 '13 at 17:59
  • 4
    The answer depends on what "other analysis" you have in mind. Even when 10,000 values very closely approximate a Normal distribution, a distribution test (like the K-S or S-W) will reject the hypothesis of Normality, even though the data are *beautifully* behaved for other analyses. Perhaps you could edit this question to indicate the nature of the follow-on analyses you have in mind. In the meantime, searching our site will turn up dozens (if not hundreds) of discussions of this issue. – whuber Jun 21 '13 at 18:12
  • 1
    +1 to @whuber and to all sceptics on tests. Specifically, note that Kolmogorov-Smirnov requires adjustment if parameters are estimated, as they usually are. With sample size $\sim 10^4$ testing is arguably not the issue, but you might still benefit from some indicator as a warning, but what indicator that will be depends on quite how your work depends on normality. – Nick Cox Jun 21 '13 at 18:30
  • 1
    While I am also skeptical of blind use of hypothesis tests, the OP was asking for a "concrete test" to "run while he is sleeping". I do agree with @whuber that what is approximately Gaussian depends on the type of follow up analysis to be done. Knowing what other analysis is to be done with the data would be helpful. – caburke Jun 21 '13 at 19:26
  • Oh,okay, sorry. I'll delete that. And, eventually, this. – Glen_b Jun 22 '13 at 08:13
  • @whuber Thanks for your comment, I thought about it over the weekend, and have edited my post under 'edit'. Kindly take a look please, thank you. – Creatron Jun 24 '13 at 14:50
  • @caburke Thank you, I have edited my post to clarify. – Creatron Jun 24 '13 at 14:51
  • Somewhat related: http://stats.stackexchange.com/questions/2492/is-normality-testing-essentially-useless – Gala Jun 24 '13 at 15:30

1 Answers1

14

There are an infinite number of ways of being non-Gaussian.

For example, you mentioned skewness and kurtosis - while those measures are certainly ways of identifying distributions that aren't Gaussian, and they can be combined into a single measure of deviation from Gaussian-ness* (and even form the basis of some common tests of normality), they're terrible at identifying distributions that have the same skewness and kurtosis as a normal but are distinctly non-normal.

* (see the tests by Bowman and Shenton and the better known - but less well-done, I think - work of Jarque and Bera)

Here's an example of the density of one such distribution: dgam 2.3

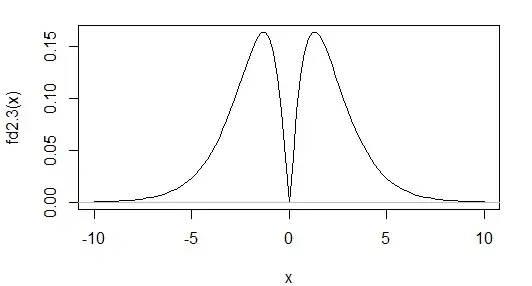
It's bimodal, but has skewness 0, and kurtosis 3.00 (to two d.p. -- i.e. an excess kurtosis of 0), the same as the normal.

A measure based on skewness and kurtosis is going to be terrible at identifying distributions such as these. Of course, if you're not worried about such possibilities, this may not matter -f you mainly want to pick up cases where the skewness and kurtosis deviate from those of the normal, a test based on those two measures is relatively powerful.

(Incidentally, the Shapiro-Wilk test is fairly good at spotting this one.)

Ultimately, choosing such a measure (whether you intend to formally test it or not) is a matter of finding things that are good at distinguishing the particular kinds of non-normality you care about. (In hypothesis-test-ese, the ones that have good power against the specific alternatives of interest.)

So work out what features you want to 'see' best, and choose a measure that is good at seeing those things.

The chi-square you mention probably refers to the chi-square goodness of fit test. It's generally a very weak test of goodness of fit for anything other than distributions over nominal categories. (Alternatively, it might be a reference to the asymptotic chi-square distribution of the Jarque-Bera type test. Be warned, the asymptotics there kick in very, very slowly indeed.)

Popular tests of normality would start with the Shapiro-Wilk and Shapiro-Francia. The Anderson-Darling** test can be adapted to work with parameter estimation and has good power. There's also smooth tests of goodness of fit (see the little book by Rayner and Best by that name, and their many papers, as well as the more recent book on Smooth tests in R); the smooth test for normality is quite powerful.

** With hypothesis tests that assume a completely specified distribution, such as the Kolmogorov-Smirnov and the Anderson-Darling, avoid using tests of normality based off estimated parameter values. The tests don't have the right properties, unless you account for that effect. In the case of the K-S, you end up with what's called a Lilliefors test. With the A-D it's still called an A-D test and if you check the book by D'Agostino & Stephens I mention below, there are approximations which adapt the usual test that seem to work quite well even with fairly small n.

If you don't want a formal hypothesis test, just about any of the usual test statistics can be adapted to be a measure that has some kind of interpretation or other as a measure of non-normality. For example, a Shapiro-Francia test statistic can be seen as a rescaled version of a squared correlation of observations with their normal scores (expected normal order statistics), and such a measure is an excellent accompaniment to a normal QQ plot.

I want to determine if these data are Gaussian.

I bet you a dollar they aren't Gaussian, and I bet you don't even need a test to tell that. What you really want to know is likely something else.

Note that usually the interesting question isn't 'are my data normal' (the answer is almost always 'obviously not', even before you collect any observations). The interesting question is 'how badly will the non-normality I have affect whatever I am trying to do?' ... and that's usually better judged by some measure of how non-normal it is, rather than a p-value.

Good places to start reading about goodness of fit (if you have access to a suitable library) would be the book Goodness of Fit Techniques by D'Agostino and Stephens and the aforementioned book on smooth tests by Rayner and Best; alternatively there are many papers and discussions you can find online, including many answers relating to goodness of fit here. Outside of some papers that are online, smooth tests can be hard to find information on, but one of Cosma Shalizi's courses has some excellent notes see here that serve as a (somewhat mathematical) introduction to the ideas.

[Goodness of fit is a surprisingly big area.]


For additional useful points, see also here or here or here or here

Glen_b
  • 257,508
  • 32
  • 553
  • 939
  • Thank you very much Mr GlebB I have to look over and study what you have said, I will comment back tomorrow. – Creatron Jun 24 '13 at 03:44
  • Glen_B, I have edited my post to clarify based on what you have said, kindly take a look, thank you. – Creatron Jun 24 '13 at 14:50
  • 1
    I don't think your edits allow more precise advice. You are telling us nothing about your data or even about what kinds of deviation from Gaussianity you fear. No indicator of non-Gaussianity, scalar or vector, leads ineluctably to identification of a better distribution. If the main issue were skewness, it might be that you should think of in terms of gamma distributions; or if it were fatter tails, of a family of t distributions. Both of these families have Gaussian as a limiting case. If you ask around, you would get other suggestions. – Nick Cox Jun 24 '13 at 15:12
  • @NickCox I thought I made that clear in the edits: After looking at my data my data is either going to be a Gaussian in one extreme, or a Gaussian 'with long tails' in the other. That would pretty much summarize my data. – Creatron Jun 24 '13 at 15:24
  • 1
    I think I see what you are getting at, but you need to sharpen up your terminology. A Gaussian with long tails is just another Gaussian, but one with a high standard deviation. I think you mean a symmetric distribution with higher kurtosis than the Gaussian; if so the family of t distributions might be a possibility for you. But as said, high SD is consistent with being Gaussian. – Nick Cox Jun 24 '13 at 15:28
  • @NickCox Apologies for terminology, this is a case of where 'I dont know what I dont know', I am trying my best to keep up/learn where I can, and then use proper terminology. Yes, I mean symmetric distribution, with higher kurtosis than a Gaussian... yes, looking at Student-T-Distribution, this might be the other extreme my data goes to. Thanks for that. – Creatron Jun 24 '13 at 15:42
  • @TheGrapeBeyond I bet your data aren't t-distributed either. There are an infinite number of distributions that are roughly symmetric vaguely bell-shaped but heavier-tailed than normal. – Glen_b Aug 31 '13 at 23:32
  • @Nic Cox - A Gaussian *never* has long tails, in the technical sense; see: http://en.wikipedia.org/wiki/Heavy-tailed_distribution#Definition_of_long-tailed_distribution – capybaralet Mar 31 '15 at 22:43
  • @Creatron, if your distribution has long tails, it is not Gaussian, see: http://en.wikipedia.org/wiki/Heavy-tailed_distribution#Definition_of_long-tailed_distribution – capybaralet Mar 31 '15 at 22:44
  • @user2429920 I strongly doubt there's any chance that NickCox was using the term in the linked sense, but was instead responding to the way the term was being used in the question. – Glen_b Mar 31 '15 at 23:17
  • 1
    @user2429920 As Glen_b underlines, my comment was a reaction to the previous comment and embedded within it was a call to sharpen up terminology. I naturally agree with your remarks. – Nick Cox Apr 01 '15 at 00:08
  • Do you happen to remember what the distribution you plotted is? It's a handy (counter-)example. – Silverfish Jul 30 '15 at 23:14
  • 1
    @Silverfish Indeed, I do; it's a "double Gamma" (in the same sense as 'double exponential' is to exponential), where the shape parameter of the gamma (I'll call it $a$ here) is about 2.302776. You can solve the equation explicitly - the kurtosis of this double gamma is $\mu'_4/(\mu'_2)^2$ for the original gamma i.e. $\Gamma(a+4)\Gamma(a)/\Gamma(a+2)^2$, which setting to 3 implies $(a+3)(a+2)=3a(a+1)$, or $a^2-a-3=0$. Which gives $a=\frac12(1+\sqrt{13})$. By symmetry (and existence of the raw moments of the gamma), the third moment is 0, so we have the same skewness and kurtosis as the normal. – Glen_b Jul 30 '15 at 23:33
  • Thanks, I thought it might be gamma but it is quite possible to misjudge by eye! – Silverfish Jul 30 '15 at 23:39
  • @Silverfish Yes. It's pretty easy to construct examples with other distributions though. I came up with this example a couple of decades back (actually, it must have been over 25 years ago now), originally just solving the equation in $\Gamma$'s by trial and error (in essence proceeding by something between binary section, regula falsi and guessing; it sufficed at the time I guess). It was an embarrassingly long time before I realized it was just the solution of a quadratic. Coming up with examples/counterexamples like these is fun. – Glen_b Jul 30 '15 at 23:41