2

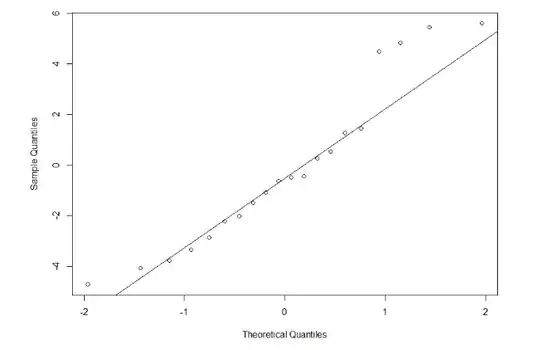
The ends of these graphs confuse me. I know most of the values fall on or near the line. But I am unsure of whether the data is indeed approximately normal. These are the two graphs.

Plot 1:

enter image description here

Plot 2:

enter image description here

Glen_b
  • 257,508
  • 32
  • 553
  • 939
Chris
  • 21
  • 2

2 Answers2

4

It's hard to say too much one way or the other from those plots. They certainly don't seem to deviate too wildly from the expected normal distribution shape. (Of course, they don't match perfectly either.) You may be OK with assuming normality, many tests are pretty robust to violations of the assumption of normality anyway.

On the other hand, you really are best off using methods that don't require these assumptions in the first place instead of checking and then choosing a test afterwards. (For more on that, it may help to read this excellent CV thread: How to choose between t-test or non-parametric test e.g. Wilcoxon in small samples.)

gung - Reinstate Monica
  • 132,789
  • 81
  • 357
  • 650
  • 1
    Actually, one can obtain fairly precise p-values from these graphs by looking for the greatest horizontal deviations from the line. *E.g.*, in plot 1 it occurs for the point near $(0.9, 4.4)$, which ought to be near $(1.9, 4.4)$. The values $0.9$ and $1.9$ are the 82nd and 97th percentiles of the standard Normal distribution, a difference of $0.15$. For $n=20$ (the number of points in that plot), Lilliefors' original 1967 JASA article indicates the p-value would be slightly greater than $0.20$. Although this is not quite valid for residuals (which are correlated), it's a good approximation. – whuber Jul 30 '15 at 13:49
0

Use a Shapiro-Wilk test in R to test for normality. Null Hypothesis is Data is Normal.

Hidden Markov Model
  • 938
  • 1
  • 8
  • 16
  • 4
    There are many tests for normality (see: [here](http://stats.stackexchange.com/a/62320/) & [here](http://stats.stackexchange.com/a/1723/)). You might also find [this](http://stats.stackexchange.com/q/2492/) interesting to read. – gung - Reinstate Monica Jul 29 '15 at 23:03
  • 6
    Rejection only tells you the non-normality is detectable with the test you use, not how much it matters, and failure to reject doesn't tell you that everything is fine (especially in small samples). In neither case does using the test really solve the problem at hand -- "are my data near enough to normal" for whatever purpose you're assessing normality for. – Glen_b Jul 29 '15 at 23:53
  • Good comment it got me thinking. You didn't indicate the importance of normality in your original post. Also, the question of "Is normality important?" is quite different from "Is my data normally distributed?". – Hidden Markov Model Jul 31 '15 at 18:24