Consider the following code and output:
  par(mfrow=c(3,2))
  # generate random data from weibull distribution
  x = rweibull(20, 8, 2)
  # Quantile-Quantile Plot for different distributions
  qqPlot(x, "log-normal")
  qqPlot(x, "normal")
  qqPlot(x, "exponential", DB = TRUE)
  qqPlot(x, "cauchy")
  qqPlot(x, "weibull")
  qqPlot(x, "logistic")
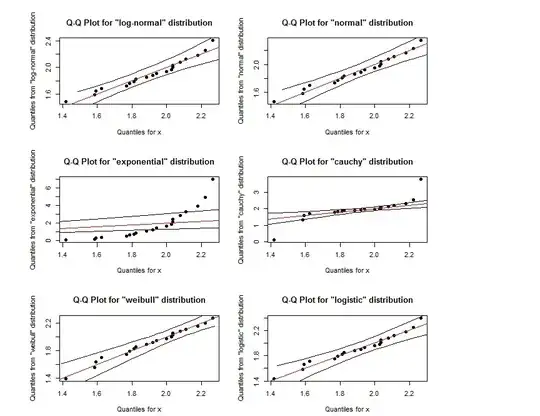
It seems that that Q-Q plot for log-normal is almost the same as the Q-Q plot for weibull. How can we distinguish them? Also if the points are within the region defined by the two outer black lines, does that indicate that they follow the specified distribution?