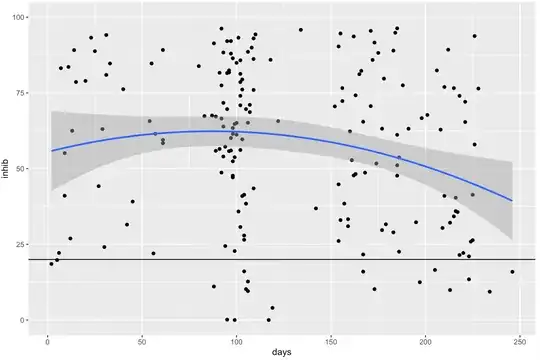
I have the following data.frame:
structure(list(days = c(11, 23, 31, 6, 9, 54, 61, 179, 195, 209,
223, 42, 56, 106, 162, 225, 96, 161, 89, 154, 218, 98, 159, 224,
104, 155, 246, 99, 159, 225, 91, 152, 210, 118, 166, 228, 98,
154, 213, 100, 156, 215, 102, 154, 87, 157, 215, 93, 163, 93,
163, 221, 109, 162, 226, 103, 168, 95, 160, 216, 102, 167, 223,
98, 167, 95, 155, 212, 107, 165, 221, 95, 173, 110, 171, 101,
175, 96, 173, 97, 172, 108, 184, 93, 174, 183, 15, 31, 61, 177,
205, 61, 171, 100, 178, 103, 188, 92, 185, 102, 185, 102, 185,
186, 197, 213, 234, 177, 191, 208, 55, 83, 88, 201, 218, 80,
183, 89, 186, 97, 198, 122, 210, 91, 217, 101, 220, 2, 5, 7,
9, 12, 13, 14, 20, 25, 27, 29, 30, 33, 40, 45, 57, 88, 92, 92,
92, 93, 94, 94, 95, 96, 97, 97, 98, 98, 98, 99, 99, 99, 100,
102, 102, 102, 103, 103, 104, 104, 104, 105, 105, 105, 106, 106,
106, 107, 109, 109, 109, 117, 119, 134, 142, 156, 167, 185, 206,
216, 226), inhib = c(83.57963875, 93.24028462, 94.11379987, 22.1713538260301,
55.12658228, 65.688842325825, 59.4552121529597, 31.6372343609698,
32.2840690978887, 30.4054054054054, 21.0394914491449, 31.5132605304212,
21.9941348973607, 65.1536119568226, 47.7383863080685, 41.3663663663664,
55.7708275671187, 52.8117359413203, 55.8815388873512, 26.1002444987775,
21.4764719715215, 61.4724605590922, 33.3129584352078, 25.9009009009009,
27.9001468428781, 33.0073349633252, 15.9159159159159, 22.7864583333333,
30.9902200488998, 26.3663190643389, 81.640625, 70.5378973105135,
40.990990990991, 85.9275575134606, 82.2738386308068, 76.4264264264264,
47.1120900636319, 44.8044009779951, 32.1321321321321, 61.2090063631914,
72.3105134474328, 76.5765765765766, 85.7562408223201, 90.3422982885086,
67.5339053418212, 38.4474327628362, 34.2342342342342, 63.8804317741489,
48.2273838630807, 88.34763354553, 74.2053789731051, 65.3903903903904,
75.9911894273128, 93.6430317848411, 93.7687687687688, 59.6734016053141,
48.6552567237164, 69.6374204262386, 62.2860635696821, 35.960960960961,
30.722391364517, 21.6381418092909, 13.4384384384384, 63.4099086631608,
65.4645476772616, 92.0949583945179, 94.6210268948655, 89.2642642642643,
71.0474791972589, 81.1735941320293, 72.0720720720721, 0.130208333333337,
10.2078239608802, 94.3220753793441, 95.4767726161369, 93.2189316357598,
88.2029339853301, 82.4245779130916, 91.6259168704157, 92.1118184334348,
85.880195599022, 89.9529476889012, 94.8655256723716, 53.9994464433988,
51.7114914425428, 28.947972972973, 78.59879584, 80.94936709,
58.374733853797, 29.691709069141, 16.5451055662188, 89.1767210787793,
70.6375336725531, 84.9155826183227, 79.7011559063998, 76.1140326598395,
77.5021144629264, 96.2358151120952, 96.3349309275444, 74.0381954054802,
61.1502678319707, 81.2897868807085, 47.6740907809416, 22.568093385214,
12.4998648648649, 9.90403071017274, 9.35030558055806, 63.1846752469321,
63.1633783783784, 62.8790786948177, 84.719481251762, 67.3423423423423,
91.3645170218655, 67.7177177177177, 74.024024024024, 83.8361472460559,
88.963963963964, 67.2017713811237, 53.6786786786787, 87.9878217547744,
66.6666666666667, 65.6877141458639, 76.9599595094645, 56.4904511486299,
35.6606606606607, 35.8296622613803, 22.1471471471472, 18.52764094,
19.81390257, 83.16455696, 41.0398953564421, 26.92939245, 62.5,
89.13519431, 78.9556962, 88.7835186396338, 44.19813903, 63.0477436232832,
24.11392405, 84.7128712871287, 76.22629169, 39.1304347826087,
61.5054602184087, 11.0677083333333, 66.5375034597288, 48.6853030722391,
77.4702463326875, 71.7132576805978, 24.4357638888889, 57.2482638888889,
81.5665651812898, 81.7603099916967, 55.9895833333333, 60.1162468862441,
52.4229074889868, 47.65625, 86.4378632715195, 0, 53.7689672050906,
64.7107666758926, 65.0982562967063, 70.9006363191385, 56.1429270680372,
78.5773595350125, 40.9355106559646, 79.4353722668143, 41.3607440039158,
26.5051395007342, 16.054821341165, 38.4238864415076, 10.2131192914476,
69.652471855115, 9.5692608908468, 12.7170138888889, 88.569056185995,
68.6686963742042, 86.1967694566814, 43.4818710213119, 92.9975089952948,
0, 4.01370533529125, 95.83956899132, 36.8581907090465, 76.5892420537897,
15.9775675675676, 51.1136171412461, 82.4252019796574, 40.3903903903904,
57.957957957958)), row.names = c(NA, -189L), class = c("tbl_df",
"tbl", "data.frame"))
I fit a second degree polynomial model to the data:
fit2 <- lm(inhib ~poly(days,2), data = dat)
and it looks like this in ggplot:
  ggplot(dat, aes(days, inhib))+
  geom_point()+
  geom_smooth(method='lm', formula = y~poly(x,2))+
  ylim(c(0,100))+
  geom_hline(yintercept = 20)
What I would like to do is predict the x(days) at which the model predicts y(inhib) = 20 with confidence intervals in days.
In other words the x value where the blue line intercepts the black line, with confidence intervals in terms of x.
Using the predict function I can put in a few values and eventually get to:
>predict(fit2, data.frame(days = 302), interval = 'confidence')

      fit       lwr      upr
>1 20.33934 -7.256038 47.93471
but this is telling me that at y=20.33934 (CI -7.25 to 47.93) at x = 302 days,
What I want to be able to predict from the model is at y=20 x = ?days (CI ?lower to ?upper)
I am sure there is something basic I am missing here...
