Summary of Study
Participants worked in pairs to complete three tasks. Periodically throughout the interaction, they evaluated one another across a variety of categories. The primary category of interest for this analysis is comprehensibility, which participants rated using a 100-point scale. We are interested in examining how comprehensibility ratings fluctuate over time.
Variables
- Comprehensibility: Continuous, 0-100
- Time: Continuous, 0-6 (represents the time at which the ratings occurred; ratings occurred at equally spaced intervals)
- Speaker: Categorical/grouping variable, 1-40
- Pair: Categorical/grouping variable, 1-20
Summary of the Problem
I have fit and evaluated a number of polynomial mixed-effects models using the poly function to estimate orthogonal time terms to avoid autocorrelation. I fit the following polynomial models: null/intercept, linear, quadratic, and cubic growth. I also fit a piecewise model in which I recoded time into separate variables representing the first four data points (time 0, 1, 2, and 3) and the second three data points (time 4, 5, and 6), labelled time03 and time46. I then constrained the quadratic slope to occur only during time03. These models were informed by plots of the data (individual and group trajectories) showing a U-shaped trajectory over the first few data points and a linear trajectory over the last few data points.
I used likelihood ratio tests to compare models. With the addition of each polynomial term, model fit improved: null < linear < quadratic < cubic. When I compared the piecewise and the cubic models, both containing the same number of parameters, the piecewise model proved to be a slightly better fit. I'm including a plot of the group-level trend for reference at the end of this post.
When I call the summary of the model, the linear predictor over time 0-3 is not significant, poly(time03, 2)1, but the quadratic predictor is, poly(time03, 2)2. What is the interpretation of the significant quadratic trend when the linear trend is not significant?
Model Summary
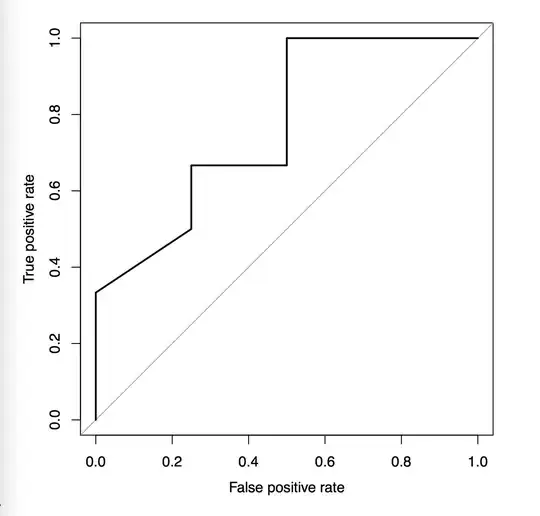
Plot
Note that in the plot, time has been relabeled 1-7, but models were fit to data labeled 0-6.
Update
I realized I should have included orthogonal polynomials as one of the tags. I found the following posts related to that topic helpful: How to interpret coefficients from a polynomial model fit?, Polynomial regression P value is getting altered, and Why the significance of terms in orthogonal polynomial regression changes with the degree of the regression.
I understand that the significant quadratic slope essentially represents the U-shaped curve over the first few data points, but I'm still confused about the non-significance of the linear term. I had assumed that if a higher-order polynomial is significant, then the lower-order terms would be as well, since I thought the higher-order term(s) represent curvature or deviation from the lower-order terms. Incidentally, in the cubic model fit to the entire data set consisting of all 7 points in time, poly(time, 3), all three predictors were significant.

