1

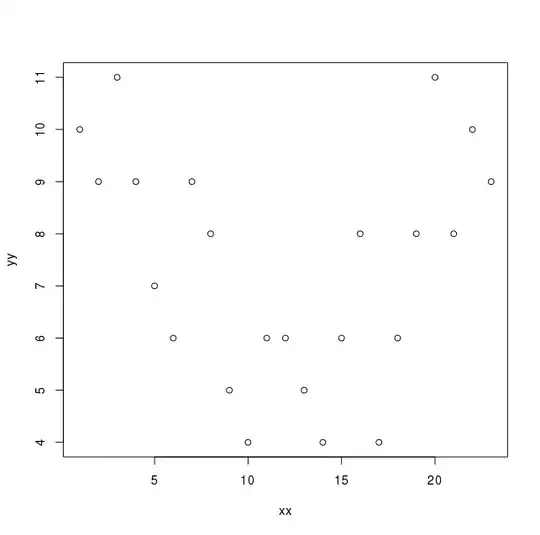
I am running following data and code for analyzing non-linear regression and to get simplest equation of curve that fits the data:

> dput(ddf)
structure(list(xx = 1:23, yy = c(10L, 9L, 11L, 9L, 7L, 6L, 9L, 
8L, 5L, 4L, 6L, 6L, 5L, 4L, 6L, 8L, 4L, 6L, 8L, 11L, 8L, 10L, 
9L)), .Names = c("xx", "yy"), row.names = c(NA, -23L), class = "data.frame")
> 
> head(ddf)
  xx yy
1  1 10
2  2  9
3  3 11
4  4  9
5  5  7
6  6  6

enter image description here

> fit = lm(yy ~ poly(xx, 9), data=ddf)
> summary(fit)

Call:
lm(formula = yy ~ poly(xx, 9), data = ddf)

Residuals:
    Min      1Q  Median      3Q     Max 
-1.9890 -1.2031  0.1086  0.7493  2.4248 

Coefficients:
              Estimate Std. Error t value Pr(>|t|)
(Intercept)   7.347826   0.356758  20.596 2.62e-11
poly(xx, 9)1 -0.880172   1.710953  -0.514 0.615582
poly(xx, 9)2  7.821383   1.710953   4.571 0.000524  # NOTE THIS
poly(xx, 9)3  0.424579   1.710953   0.248 0.807892
poly(xx, 9)4 -2.151779   1.710953  -1.258 0.230641
poly(xx, 9)5 -0.876964   1.710953  -0.513 0.616857
poly(xx, 9)6 -0.961726   1.710953  -0.562 0.583610
poly(xx, 9)7 -0.002171   1.710953  -0.001 0.999007
poly(xx, 9)8 -0.051884   1.710953  -0.030 0.976269
poly(xx, 9)9  0.840177   1.710953   0.491 0.631571

Residual standard error: 1.711 on 13 degrees of freedom
Multiple R-squared:  0.6451,    Adjusted R-squared:  0.3993 
F-statistic: 2.625 on 9 and 13 DF,  p-value: 0.05575

If I use 'raw=TRUE' :

> fit = lm(yy ~ poly(xx, 9, raw=TRUE), data=ddf)
> summary(fit)

Call:
lm(formula = yy ~ poly(xx, 9, raw = TRUE), data = ddf)

Residuals:
    Min      1Q  Median      3Q     Max 
-1.9890 -1.2031  0.1086  0.7493  2.4248 

Coefficients:
                           Estimate Std. Error t value Pr(>|t|)
(Intercept)               2.844e+00  1.529e+01   0.186    0.855
poly(xx, 9, raw = TRUE)1  1.310e+01  2.711e+01   0.483    0.637
poly(xx, 9, raw = TRUE)2 -8.439e+00  1.723e+01  -0.490    0.632  # NOTE THIS
poly(xx, 9, raw = TRUE)3  2.637e+00  5.432e+00   0.485    0.635
poly(xx, 9, raw = TRUE)4 -4.719e-01  9.715e-01  -0.486    0.635
poly(xx, 9, raw = TRUE)5  5.112e-02  1.048e-01   0.488    0.634
poly(xx, 9, raw = TRUE)6 -3.400e-03  6.937e-03  -0.490    0.632
poly(xx, 9, raw = TRUE)7  1.355e-04  2.757e-04   0.492    0.631
poly(xx, 9, raw = TRUE)8 -2.967e-06  6.032e-06  -0.492    0.631
poly(xx, 9, raw = TRUE)9  2.739e-08  5.578e-08   0.491    0.632

Residual standard error: 1.711 on 13 degrees of freedom
Multiple R-squared:  0.6451,    Adjusted R-squared:  0.3993 
F-statistic: 2.625 on 9 and 13 DF,  p-value: 0.05575

I find that if I do not use 'raw=TRUE', one P value (2nd) is significant, but it is not significant if I use 'raw=TRUE'. Why does this occur and what does it mean?

I asked above question at stackoverflow but was advised to post here. Thanks for your help.

rnso
  • 8,893
  • 14
  • 50
  • 94
  • Quick side note: A **polynomial regression** is still technically a *linear* regression. – Steve S Nov 16 '14 at 12:42
  • @SteveS : Very interesting. I am changing the title and the keywords. What is the correct way to analyze using non-linear regression? – rnso Nov 16 '14 at 13:16
  • High order polynomials are almost always bad choices, unless you have very strong reasons to use one (even, frankly, when you *know* your data are from noise around a high order polynomial, it can be a risky choice for a fitted model, since such fits can be very sensitive to small movements in a few points). It seems highly inadvisable to use a 9th degree polynomial for these data. Is there are decent reason to do so? – Glen_b Nov 16 '14 at 23:52

1 Answers1

3

The first point to note is that fitting a 9th degree polynomial is likely to involve overfitting unless you have a theoretical reason for it.

The second point is that your two regressions result in the same fitted points (the residuals from your two regressions are identical up to machine rounding).

When you use raw=TRUE you are telling poly not to ensure the polynomials used in the regression are orthogonal. In that case they interfere with each other, and you can see the impact on the various numbers for t value being almost the same in magnitude, telling you little.

When omitting raw=TRUE (i.e. using the default raw=FALSE), you get a better view of the different impacts, and the large t value for poly(xx, 9)2 suggests you might want to look just at second degree polynomial fitting, though this still does not provide a theoretical justification for doing so. This in turn suggests your data may be essentially U shaped, something which is fairly obvious from your plot.

Henry
  • 30,848
  • 1
  • 63
  • 107
  • Thanks for your explanation. If I have a plot which is a complex curve, can we use poly(xx,9) (without using raw=TRUE) to find out which degree polynomial will fit the best. Is this a valid approach? Also, if 2rd and 5th degree polys are significant, can we use an equation that has only these coefficients, ignoring others. I am trying to get the simplest equation possible to fit in the curve. I am using 'raw=TRUE' to get actual coefficients for the equation. – rnso Nov 16 '14 at 11:41
  • I am not a fan of polynomial regression without a theoretical justification, though it might sometimes work for interpolation (not extrapolation) as a way of drawing a smooth curve. If you must go down this route, you might consider using the orthogonal polynomials to decide which is the highest degree you are going to take into account, and then re-regress on the raw polynomials of that degree and smaller to get coefficients which can easily be implemented, even though the reported statistics about the coefficients of the re-regressed raw polynomials are meaningless. – Henry Nov 16 '14 at 14:11
  • If only 2rd and 5th degree polynomials (orthogonal) are significant, should I put 3rd and 4th degree polynomials also in final equation? – rnso Nov 16 '14 at 14:13
  • Almost certainly yes if you are going to use the raw polynomials in the final equation, probably yes even if not. And the 1st (linear) and 0th (constant) degrees too. – Henry Nov 16 '14 at 14:17
  • Thanks for your insight. Last point I would like to know is how to use orthogonal coefficients in the final equation? Any good weblinks if the answer is long? – rnso Nov 16 '14 at 14:25