4

I have a problem with a dataset where I do not exactly know how to work with.

Here it is:

  Jahr GRP TKP COST
1 2012 100 100  100
2 2013  92  95   88
3 2014  88  96   85
4 2015  78 110   87
5 2016  84 110   94
6 2017  76 130  100
7 2018  65 145   97
8 2019  63 149   96

My company wants to predict the values for "TKP" for the upcoming year 2020. The covariates for the model are "GRP" and "COST". I don´t have the values for my covariates too, so actually my prediction is just based on data from the past.

I can not just run a regression or something like this, because I would need to covariates for 2020 to do this, right? Do I have to predict TKP and COST first with something like ARIMA and then predict the GRP with a regression model? Is my dataset large enough to predict anything? Our predictions will be measured against the predictions of the system, which should just the average change of the last years, nothing special.

Can you help me how to work with on this problem?
kjetil b halvorsen
  • 63,378
  • 26
  • 142
  • 467
DSGym
  • 143
  • 5
  • 2
    Given that you have multiple time series you could try a VAR model, which would model all the time series simultaneously. Assuming the other time series are actually relevant for your outcome. – user2974951 Aug 26 '19 at 13:24
  • thank you, I will have a look at that. – DSGym Aug 26 '19 at 13:54
  • 3
    8 observations in general is not evidence enough for decision making, so maybe use the data to illustrate a trend and try to gather more data if that's available? If you don't have more than 8 years, then maybe look at seasonal (or quarterly data) to give you more granular data across those 8 years? Anyways - good luck! – Samir Rachid Zaim Aug 26 '19 at 13:55
  • 1
    The data in your post appears to be well modeled by a very simple, linear, flat plane equation "TKP = a + (b * GRP) + (c * COST)" independent of year. I found parameters a = 1.0569060671397898E+02, b = -1.4328483976959001E+00, and c = 1.3588958650598641E+00 yield RMSE = 2.165 and R-squared = 0.9885 – James Phillips Aug 26 '19 at 15:09
  • 2
    @JamesPhillips Why not turn that into an answer? I think that you can probably skip at least a dozen of those decimal points, though... – mkt Aug 26 '19 at 15:35
  • Related: [Best method for short time-series](https://stats.stackexchange.com/q/135061/1352) – Stephan Kolassa Sep 04 '19 at 16:28

1 Answers1

3

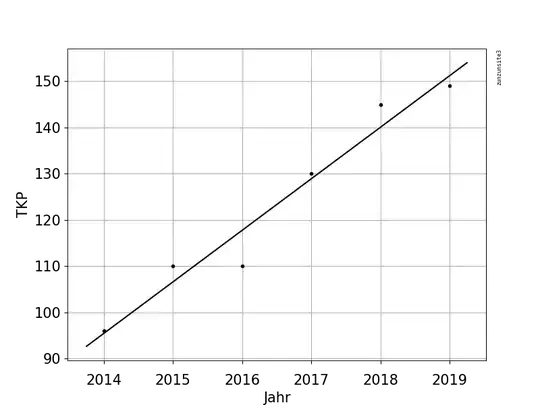
If you only look at the last five years, then year alone can be used to predict TKP using a straight line:

plot

James Phillips
  • 1,158
  • 3
  • 8
  • 7
  • 1
    There are many, many many datasets which all look like this. Hopefully this also applies to them :-) – DSGym Aug 26 '19 at 17:03
  • 1
    Because this is a straight line model, you should be able to somewhat easily automate running a similar "last five years" model on those data sets, and then inspect the resulting distribution of RMSE and R-squared to find the maximum, minimum and mean values. Such an automated test would tell you if this is generally applicable across the multiple data sets - or if I just got lucky with this one. For the RMSE comparisons, the dependent data values should be roughly in the same range or else that comparison is invalid. – James Phillips Aug 26 '19 at 19:10
  • 2
    +1. This is a very good benchmark, and I doubt that more complex methods would be meaningfully better. It might be a good idea to dampen the trend forecast, especially for longer horizons. – Stephan Kolassa Sep 04 '19 at 16:27