This question is related to my previous question. I would like to put values over bars in barplot. I am beginner in plotting in R.
Asked
Active
Viewed 9.1k times
3 Answers
16
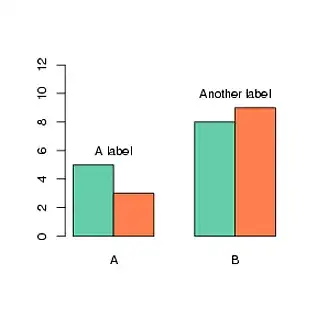
To add text to a plot, just use the text command. From @chl's answer to your previous question:
##Create data
x = replicate(2, sample(letters[1:2], 100, rep=T))
apply(x, 2, table)

##Create plot
barplot(matrix(c(5, 3, 8, 9), nr=2), beside=TRUE,
        col=c("aquamarine3", "coral"),
        names.arg=LETTERS[1:2],
        ylim=range(0,12)))

##Add text at coordinates: x=2, y=6
##Use trial and error to place them
text(2, 6, "A label")
text(5, 10, "Another label")
csgillespie
- 11,849
- 9
- 56
- 85
-
4I don't really understand why this option was added to `hist()` (`labels=T`) and not `barplot()`. – chl Oct 22 '10 at 18:07
7
Another example of the use of text command
u <- c(3.2,6.6,11.7,16.3,16.6,15.4,14.6,12.7,11.4,10.2,9.8,9.1,9.1,9.0,8.8,8.4,7.7)
p <-c(3737,3761,3784,3802,3825,3839,3850,3862,3878,3890,3901,3909,3918,3926,3935,3948)
     -c(385,394,401,409,422,430,434,437,437,435,436,437,439,442,447,452)
e <- c(2504,2375,2206,2071,2054,2099,2127,2170,2222,2296,2335,2367,2372,2365,2365,2401)

par(mar=c(2,3,1,2),las=1,mgp=c(2.2,1,0))
x <- barplot(u,names.arg=1990:2006,col="palegreen4",space=.3,ylim=c(0,20),
              ylab="%",xaxs="r",xlim=c(.8,21.6))
text(x,u+.4,format(u,T))
lines(x[-17],100*e/p-55,lwd=2)
points(x[-17],100*e/p-55,lwd=2,cex=1.5,pch=1)
axis(4,seq(0,20,5),seq(55,75,5))
text(c(x[1]+1,x[5],x[16]+1),c(100*e/p-55)[c(1,5,16)]+c(0,-1,0),
      format(c(100*e/p)[c(1,5,16)],T,di=3))
box()
George Dontas
- 6,154
- 3
- 34
- 49
3
If you're learning to plot in R you might look at the R graph gallery (original here).
All the graphs there are posted with the code used to build them. Its a good resource.
gung - Reinstate Monica
- 132,789
- 81
- 357
- 650
Chris
- 470
- 3
- 10