I want to create a bardiagram for these data in R (read from a CVS file):
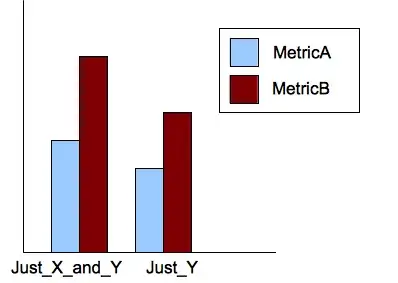
Experiment_Name MetricA MetricB Just_X 2 10 Just_X_and_Y 3 20
to have the following diagram:
I am beginner and I do not know even how to start.
I want to create a bardiagram for these data in R (read from a CVS file):
Experiment_Name MetricA MetricB Just_X 2 10 Just_X_and_Y 3 20
to have the following diagram:
I am beginner and I do not know even how to start.
I shall assume that you are able to import your data in R with read.table() or the short-hand read.csv() functions. Then you can apply any summary functions you want, for instance table or mean, as below:
x <- replicate(4, rnorm(100))
apply(x, 2, mean)
or
x <- replicate(2, sample(letters[1:2], 100, rep=T))
apply(x, 2, table)
The idea is to end up with a matrix or table for the summary values you want to display.
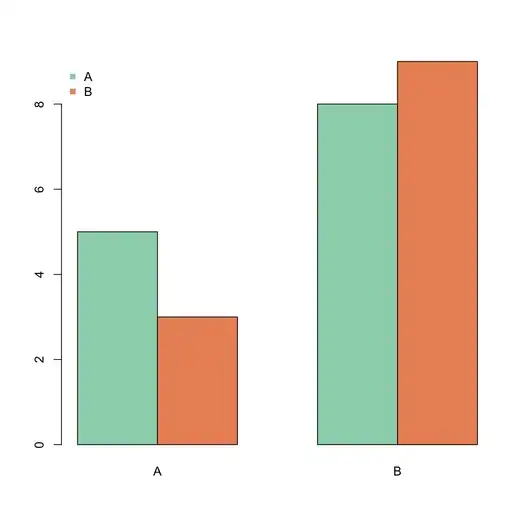
For the graphical output, look at the barplot() function with the option beside=TRUE, e.g.
barplot(matrix(c(5,3,8,9),nr=2), beside=T,
        col=c("aquamarine3","coral"),
        names.arg=LETTERS[1:2])
legend("topleft", c("A","B"), pch=15,
       col=c("aquamarine3","coral"),
       bty="n")
The space argument can be used to add an extra space between juxtaposed bars.
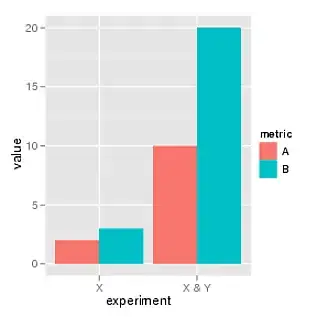
Here ggplot version:
library(ggplot2)
df = melt(data.frame(A=c(2, 10), B=c(3, 20),
          experiment=c("X", "X & Y")),
          variable_name="metric")

ggplot(df, aes(experiment, value, fill=metric)) +
       geom_bar(position="dodge")
I wanted to update teucer's answer to reflect reshape2.
library(ggplot2)
library(reshape2)
df = melt(data.frame(A=c(2, 10), B=c(3, 20),
                 experiment=c("X", "X & Y")),
      variable.name="metric")

ggplot(df, aes(experiment, value, fill=metric)) +
  geom_bar(position="dodge",stat="identity")
Note that teucer's answer produces the error "Error in eval(expr, envir, enclos) : object 'metric' not found" with reshape2 because reshape2 uses variable.name instead of variable_name.
I also found that I needed to add stat="identity" to the geom_bar function because otherwise it gave "Error : Mapping a variable to y and also using stat="bin"."