53

If I have a data set that produces a graph such as the following, how would I algorithmically determine the x-values of the peaks shown (in this case three of them):

enter image description here

Matt Krause
  • 19,089
  • 3
  • 60
  • 101
nonaxiomatic
  • 531
  • 1
  • 5
  • 4
  • 15
    I see six local maxima. To which three are you referring? :-). (Of course it's obvious--the thrust of my remark is to encourage you to define a "peak" more precisely, because that's the key to creating a good algorithm.) – whuber Sep 14 '12 at 16:12
  • 3
    If the data is a purely periodic time series with some random noise component added you could fit a harmonic regression function where period and amplitude are parameters that are estimated from the data. The resulting model would be a periodic function that is smooth (i.e. a function of a few sines and cosines) and hence it will have uniquely identifiable time points when the first derivative is zero and the second derivative is negative. Those would be the peaks. The places where the first derivative is zero and the second derivative is positive will be what we call troughs. – Michael R. Chernick Sep 14 '12 at 16:57
  • Thanks everyone for your answers and comments, it is very much appreciated! It will take me some time to understand and implement the suggested algorithms as it relates to my data, but I'll make sure I update later with feedback. – nonaxiomatic Sep 18 '12 at 11:15
  • Maybe it's because my data is really noisy, but I didn't have any success with the answer below. Though, I did have success with this answer: http://stackoverflow.com/a/16350373/84873 – Daniel Nov 19 '15 at 23:23

3 Answers3

40

A general approach is to smooth the data and then find peaks by comparing a local maximum filter to the smooth. In R:

    argmax <- function(x, y, w=1, ...) {
      require(zoo)
      n <- length(y)
      y.smooth <- loess(y ~ x, ...)$fitted
      y.max <- rollapply(zoo(y.smooth), 2*w+1, max, 
                align="center")
      delta <- y.max - y.smooth[-c(1:w, n+1-1:w)]
      i.max <- which(delta <= 0) + w
      list(x=x[i.max], i=i.max, y.hat=y.smooth)
    }

Its return value includes the arguments of the local maxima (x)--which answers the question--and the indexes into the x- and y-arrays where those local maxima occur (i).

There are two parameters to be tuned to the circumstances: w is the half-width of the window used to compute the local maximum. (Its value should be substantially less than half the length of the array of data.) Small values will pick up tiny local bumps whereas larger values will pass right over those. Another--not explicit in this code--is the span argument of the loess smoother. (It is typically between zero and one; it reflects a window width as a proportion of the range of x values.) Larger values will smooth the data more aggressively, making local bumps disappear altogether.

To see this tuning in effect, let's create a little test function to plot the results:

    test <- function(w, span) {
      peaks <- argmax(x, y, w=w, span=span)
      
      plot(x, y, cex=0.75, col="Gray", main=paste("w = ", w, ", 
              span = ", span, sep=""))
      lines(x, peaks$y.hat,  lwd=2) #$
      y.min <- min(y)
      sapply(peaks$i, function(i) lines(c(x[i],x[i]), c(y.min, 
             peaks$y.hat[i]),
             col="Red", lty=2))
      points(x[peaks$i], peaks$y.hat[peaks$i], col="Red", pch=19, 
              cex=1.25)
    }

Here are a few experiments applied to some synthetic, slightly noisy data.

    x <- 1:1000 / 100 - 5
    y <- exp(abs(x)/20) * sin(2 * x + (x/5)^2) + cos(10*x) / 5 + 
              rnorm(length(x), sd=0.05)
    par(mfrow=c(3,1))
    test(2, 0.05)
    test(30, 0.05)
    test(2, 0.2)

Plots

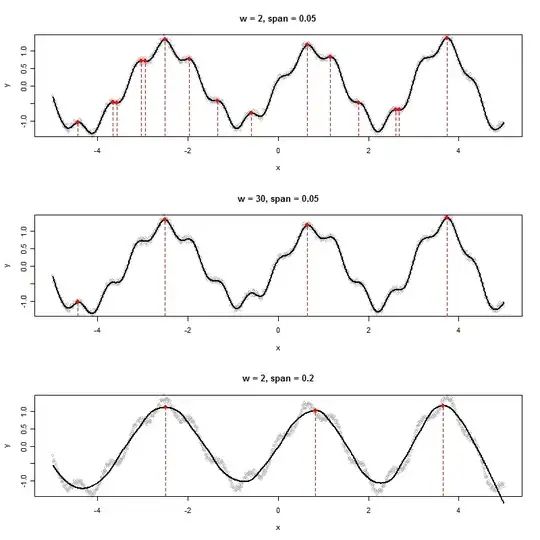
Either a wide window (middle plot) or more aggressive smooth (bottom plot) eliminate the local maxima detected in the top plot. The best combination here is likely a wide window and only gentle smoothing, because aggressive smoothing appears to shift these peaks (see the middle and right points in the bottom plot and compare their locations to the apparent peaks of the raw data). In this example, w=50 and span=0.05 does a great job (not shown).

Notice the local maxima at the endpoints are not detected. These can be inspected separately. (To support this, argmax returns the smoothed y-values.)


This approach has several advantages over more formal modeling for general purpose work:

  • It does not adopt any preconceived model of the data.

  • It can be adapted to the data characteristics.

  • It can be adapted to detect the kinds of peaks one is interested in.

kjetil b halvorsen
  • 63,378
  • 26
  • 142
  • 467
whuber
  • 281,159
  • 54
  • 637
  • 1,101
  • It seems like you are taking an approach similar to what I suggested in my comment. That is we both assume some sort of periodic function plus additive noise. My suggestion was to fit a parametric time series model of the harmonic regression kind which would be the sum of a few sine and/or cosine functions with unknown amplitudes and periods that are fit to the series. If I understand your approach correctly, you are using a LOESS (nonparametric) local smoother to make the curve smooth and look for all the local maxima that you will call the peaks. – Michael R. Chernick Sep 14 '12 at 20:40
  • It seems to me that by doing this parametrically I can compute derivatives and apply the derivative test for local maxima whereas you pick them out visually. Do i have that right? – Michael R. Chernick Sep 14 '12 at 20:42
  • 3
    On the contrary, @Michael: I assume *nothing* about periodicity. Indeed, the example looks periodic but it is not: notice the quadratic term. Harmonic regression will fail with this example (and with many other such series). Moreover, I do not pick out anything "visually": it is all done with the algorithm. (Why do I get a strong impression that you have not actually read this answer?) – whuber Sep 14 '12 at 20:42
  • Maybe because it is long and i chose to skim through it. Of course I realize that you are using a nonparametric smoother and so do not need to assume periodicity. i guess I mentioned periodicity as an assumption because it is my impression that the OP is dealing periodic functions. So score one for you, I assume periodicity and you don't. I guess I shouldn't have said visually because I did not read closely enough to fully understand how you identify the peaks. But I did have a point to make that got lost in my poor choice of words. I have an infinitely differentiable function. – Michael R. Chernick Sep 14 '12 at 21:03
  • 1
    I can find the peaks algorithmically through the first and second derivatives tests whereas you need to use some other means (maybe something like a numerical search). My point was not to try to claim one approach was better than the other nor was I criticizing your answer at all. I just see a lot of similarities and a few differences and I was trying to get a clearer understanding about how you identify your peaks. – Michael R. Chernick Sep 14 '12 at 21:08
  • 3
    @Michael The peaks are locations that do not exceed a moving maximum; this makes them fast and easy to compute: there's no numerical search, just a simple $O(n)$ scan. The advantage of using a differentiable smooth is that it can interpolate peaks between given x-values: this is useful for coarse or uneven x-resolutions. – whuber Sep 14 '12 at 22:16
  • 2
    Thanks for the interesting approach. I think I also get the point Michael was reaching for: you needed to view the charts to decide the best values for `w` and `span`, and also to discover that higher values of `span` were shifting the peaks. It feels like even these steps could be automated. E.g. for the first issue, if we could evaluate the quality of the peaks discovered, we could run `optimize` on the parameters! For the second issue, e.g. choose a window either side of the discovered peak and look for higher values. – Darren Cook Sep 21 '12 at 14:53
  • @Darren Good points! Another improvement is that once you have found a peak, you could locally interpolate the smoothed curve to make the peak more precise, if desired. One way to view this approach is that a simple non-parametric procedure helps identify approximate peaks and then you can switch to a localized procedure (even harmonic analysis, if you must) to pin down those peaks. Using local neighborhoods, besides being computationally efficient, insulates you from the problems inherent in global methods like harmonic analysis where distant data can (badly) influence the estimates. – whuber Sep 21 '12 at 14:58
1

A classic peak detection approach in signal processing is as follows:

  1. Filter the signal to some reasonable reasonable range, depending on sampling rate and signal properties, e.g. for ECG, an IIR bandpass filter @0.5-20Hz, a zero-phase filter will ensure that no phase shift (and associated time lag) is introduced
  2. A hilbert transform or a wavelet approach can then be used to emphasize the peaks
  3. A static or dynamic threshold can then be applied, where all samples above the threshold are deemed peaks. In the case of a dynamic threshold, it is usually defined as a threshold N standard deviations above or below a moving average estimate of the mean.

Another approach that works is to compare a sharply highpass filtered signal against a heavily smoothed (low-pass or median filtered) and apply step 3.

Hope this helps.

BGreene
  • 3,045
  • 4
  • 16
  • 33
1

As I mentioned in comment if the time series appears to be periodic fitting a harmonic regression model provides a way to smooth the function and identify the peak by applying the first and second derivative tests. Huber has pointed out a nonparametric test that has advantages when there are multiple peaks and the function is not necessarily periodic. But there is no free lunch. While there are the advantages to his method that he mentions there can be disadvantages if a parametric model is appropriate. That is always the flip side to using nonparametric techniques. Although it avoids parametric assumptions, the parametric approach is better when the parametric assumptions are appropriate. His procedure also does not take full advantage of the time series structure in the data. My approach does but relies on a specific form for the model that assumes periodicity.

I think that while it is appropriate to point out advantages of a suggested procedure it is also important to point out the potential disadvantages. Both my approach and Huber's find the peaks in an efficient manner. However I think his procedure takes a little more work when a local maximum is lower than the previously determined highest peak.

Michael R. Chernick
  • 39,640
  • 28
  • 74
  • 143
  • 3
    Could you please demonstrate the "efficient manner" of your approach? Part of the challenge is to devise an algorithm to find *multiple* peaks--which in your case means finding *all* zeros of an (expensively computed) derivative, not just one zero--and to be explicit about which of these critical points you will classify as "peaks" and which ones not. Also, some support for or amplification of your claim that "the parametric approach is better when the parametric assumptions are appropriate" would be good, for as we all know, parametric assumptions are never exactly correct. – whuber Sep 17 '12 at 13:56
  • @whuber I said that you would fit the model then since the modle is a sum of sines and cosines the function is periodic the peaks occur when both the first derivative is zero and the the second derivative at the zero point is decreasing. That is what I meant when i said that you take the first and second derivative tests. Now you can solve to find all the solutions but if you have one peak the others are one period and multiple periods away from the solution you have. My point is not to claim any superiority of the method. I just want to point out that there is no free lunch. – Michael R. Chernick Sep 17 '12 at 14:46
  • Nonparametric methods have the advantage of not requiring modeling assumption, in this case no assumption of periodicity. My statement about parametric approaches being better than nonparametric approaches when the modeling assumptions hold should be very familiar to you. I don't need to argue about parametric assumptions never holding exactly. That is an opinion that I basically agree with. But I am talking about something like Pitman efficiency. Nonparametric estimates are not as efficient as parametric estimates when the model is "correct". – Michael R. Chernick Sep 17 '12 at 14:52
  • That is theory. In practice parametric models can be good approximations to reality. In that case the parametric estimate (say mle) is more efficient than the nonparametric estimate. Also the parametric confidence intervals will be better because they will be tighter. But many times you don't know how good the parametric model is for your example. In such cases you have to decide between conservativism (being safe) with the nonparametric approach or being bold (and possibly wrong) using the parametric approach. – Michael R. Chernick Sep 17 '12 at 14:57
  • Regarding this time series example, I think that it is possible in practice to have a good idea that your time series is periodic and harmonic regression modeling would make sense. There is nothing wrong with taking a conservative nonparametric approach. All I am saying is that such an approach is not always better than harmonic regression and I think it is important to make that point. This argument can be made for many different problems, e.g. choosing a Weibull model for survival over the Kaplan-Meier estimate, fitting a gamma density to sample data instead of a kernel density estimate. – Michael R. Chernick Sep 17 '12 at 15:08
  • 1
    What I'm trying to suggest, Michael, is that in this case the nonparametric approach is likely to be *far* better than any parametric approach except when the data cleave especially closely to the model--and even then it will perform well. Assuming periodicity is a great example: your algorithm will make errors of the same order of magnitude as the departures from periodicity within the data. The possibility of making such mistakes nullifies any advantages conferred by greater asymptotic efficiency. Using such a procedure without conducting extensive GoF testing first would be a bad idea. – whuber Sep 17 '12 at 15:09
  • @whuber You may be right but that is opinion. I am not making any claims about what is better. I especially have no idea what would work better for the OP in this question. It is my opinion that harmonic regression is a viable approach in time series analysis and there are situations where it would work better than a nonparametric approach. At this point I have read completely the answer you gave to the OP. My only criticism is that although you mention the advantages of your approach you do not acknowledge any disadvantages. – Michael R. Chernick Sep 17 '12 at 15:50
  • All I am saying is that there could be situations where other approaches are better. It may be a parmetric approach like harmonic regression or some other method. Of course with any time series modeling I would be assessing the goodness of fit to the data and maybe even look at prediction accuracy depending on how I plan to apply the model. – Michael R. Chernick Sep 17 '12 at 15:53
  • What is GoF please? – David Epstein Sep 18 '12 at 17:44
  • @DavidEpstein Huber's notation seemed a little unfamiliar to me also. But based on the context I am quite sure he is referring to goodness of fit. – Michael R. Chernick Sep 18 '12 at 17:54
  • @whuber After giving more thought to your statement "What I'm trying to suggest, Michael, is that in this case the nonparametric approach is likely to be far better than any parametric approach except when the data cleave especially closely to the model--and even then it will perform well." I remarked that this was an opinion but I think I should object to it more strongly. During my 5 years as a mathematician at Aberdeen Proving Ground (before I could call myself a trained statistician) I had occasion to see many real world examples where exponential smoothing and ARIMA modeling were used. – Michael R. Chernick Sep 19 '12 at 10:56
  • These models are very practical and I have seen that they are valuable for forecasting or for process control. If this were not the case Box-Jenkins methodology would not be so popular. To a lesser extent the saem could be said for harmonic regression analysis. So for many applications it is just plain wrong to think that nonparametric modeling performs better. While your smoothing approach may help to identify peaks I do not think it is as useful as parametric approaches when the goal is prediction. Also, there are many times when one can reasonably expect a periodic component in data. – Michael R. Chernick Sep 19 '12 at 11:04
  • This could be a weekly, monthly, quarterly or yearly period. – Michael R. Chernick Sep 19 '12 at 11:05
  • @Michael, you omit the full quotation: My remark was prefaced by "in this case." As such, that renders your responses (which I nevertheless find interesting and do not disagree with) irrelevant to this thread. My statement was not mere "opinion": it was supported by the analysis I have provided in my answer. I invite you to supply a comparably rigorous analysis illustrating how harmonic analysis would work on data like the ones presented in this question. At this site we value hard evidence like that far more than we value opinions, no matter how stridently they are asserted. – whuber Sep 19 '12 at 13:48