Although I suggested Bayesian Changepoint Detection in the comments, I tried it out and no luck. It's the wrong method for the job.
However, I think there's a pretty straightforward way to try to accomplish this, inspired by methods in finance to accomplish a similar objective.
Before I go into my solution, I would first like to highlight a central difficulty that makes it really quite hard to get the exact results you're looking for.
Your choice of peaks/troughs is arbitrary, and is somewhat fuzzy. This is possibly unavoidable, but presents a big challenge.
Take a look at 16 and 17 . You chose those two as a peak and a trough, even though the difference between them is smaller than several oscillations earlier in the series which were not selected as peaks/troughs (take a look at the area between 2 and 3, between 5 and 6). Additionally, some of the "peaks" are fuzzy areas/zones like 20, 23 and 28 . They are not nearly as punctuated as the other peaks. My point here is that from what I can tell, the selection of peaks/troughs that you would have liked to identify in a "live" feed do not appear to be chosen based on objective criteria, which makes it harder because some of your peaks are small, others are big, and it's hard to have a method to identify small and big peaks you chose, but not intermediate ones, for example.
I know you have 3 streams of data, so perhaps your desired peak/trough choice is somehow more objective by using all 3 in some way? In any case, this is not a criticism, I am just highlighting an inherent inconsistency/difficulty.
The Proposed Solution
We're going to calculate 2 moving averages, one fast and one slow. We will say that when the fast moving average crosses the slow moving average, a peak/trough has recently occurred.
Here are the results from my attempt at it (blue lines indicate detection of a recent peak/trough):
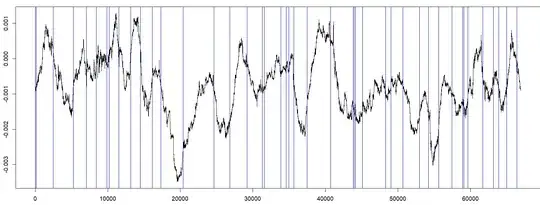 Notes:
Look in the area before the blue line to find the actual peak/trough. The blue lines are not the peaks/troughs, they are the points in time at which a recent peak/trough was determined/identified. There are a total of 44 peaks/troughs identified.
There might be some degree of data snooping/leakage, as I adjusted my model while eyeballing the whole dataset . When you are manually tuning the model (I will give below), I would recommend tuning it on one half of the data, for example, and then testing it out on the other half you haven't been staring at to make sure it's not super overfitted.
There is a clearly a time lag, which appears to be more or less within your acceptable limits, but it can be tuned at the cost of false-positives (explained in detail below).
My code in R:
series <- read.csv(file="C:\\...\\MA_meas3.csv", header=TRUE)
library(pracma)

# Fast moving average
ma1 <- movavg(series$X.0.000834974, 500, 'e')

# Slow moving average
ma2 <- movavg(series$X.0.000834974, 525, 'm')

# Plot original along with both moving averages, to get visual intuition of the
# method
plot(series$X.0.000834974, type='l')
par(new=TRUE)
plot(ma1, type='l', col='red')
lines(ma2, type='l', col='blue')

# Find peaks/troughs by applying basic rules to the two moving averages
index <- c(0)
for (i in 2:length(ma2)){
  if (ma1[i]>=ma2[i] && ma1[i-1] < ma2[i-1] && i > (index[length(index)]+100)){
    index <- c(index, i)
  }else if (ma1[i] <= ma2[i] && ma1[i-1] > ma2[i-1] && i > (index[length(index)]+100)){
    index <- c(index, i)
  }
}

# Plot peak/trough detection
abline(v=index, col='blue')
Explaining the rules within the for-loop:
The loop simply checks whether the two moving averages have just crossed or not, and whether or not this crossing happened at least 100 periods after the previous crossing. The reason I included the 100 periods rule is because without it, there are a few areas where the moving averages cross extremely often, so to thin it out, I thought it's reasonable that you probably won't have a peak and trough within 100 periods of each other, so if that's detected, it's a "false positive" by default.
What you can tune to find a better detection model using the code:
Tune the lookback periods for ma1 and ma2 (I set it at 500 and 525, respectively). The larger the lookback period, the slower moving it is. If you think this is too many false positives and you're willing to accept more lag for less false positives, increase the lookback of ma2 (and vice versa - if you need faster but more errors is fine, decrease it). Please notice that ma1 is an "exponential" moving average, as denoted by parameter 'e' . ma2 is a "modified" moving average, hence the 'm' . There are other options to play around with if you want, just find the documentation for the pracma package, movavg() function.
If you decide you only care about really big peaks (like 13 and 14, and not small ones like 16 and 17), you can simply increase the lookback values for both, ma1 and ma2, so it will be less sensitive to small oscillations.
Tune the minimum number of periods since last peak/trough . I set it at 100, but you can increase it (to further decrease number of false positives at the risk of missing a signal), or decrease it (to decrease risk of missing a very fast peak/trough switch, at cost of increasing false positives).
I hope this offers a computationally simple, flexible and reasonably effective method at identifying peaks/troughs in real time.

