9

I'm analyzing a certain dataset, and I need to understand how to choose the best model that fits my data. I'm using R.

An example of data I have is the following:

corr <- c(0, 0, 10, 50, 70, 100, 100, 100, 90, 100, 100)

These numbers correspond to the percentage of correct answers, under 11 different conditions (cnt):

cnt <- c(0, 82, 163, 242, 318, 390, 458, 521, 578, 628, 673)

Firstly I tried to fit a probit model, and a logit model. Just now I found in the literature another equation to fit data similar to mine, so I tried to fit my data, using the nls function, according to that equation (but I don't agree with that, and the author does not explain why he used that equation).

Here is the code for the three models I get:

resp.mat <- as.matrix(cbind(corr/10, (100-corr)/10))
ddprob.glm1 <- glm(resp.mat ~ cnt, family = binomial(link = "logit"))
ddprob.glm2 <- glm(resp.mat ~ cnt, family = binomial(link = "probit"))

ddprob.nls <- nls(corr ~ 100 / (1 + exp(k*(AMP-cnt))), start=list(k=0.01, AMP=5))

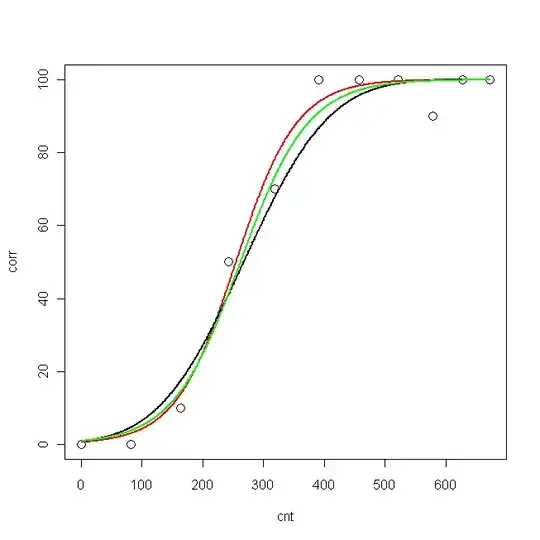
Now I plotted data and the three fitted curves:

pcnt <- seq(min(cnt), max(cnt), len = max(cnt)-min(cnt)) 
pred.glm1 <- predict(ddprob.glm1, data.frame(cnt = pcnt), type = "response", se.fit=T) 
pred.glm2 <- predict(ddprob.glm2, data.frame(cnt = pcnt), type = "response", se.fit=T) 
pred.nls <- predict(ddprob.nls, data.frame(cnt = pcnt), type = "response", se.fit=T)

plot(cnt, corr, xlim=c(0,673), ylim = c(0, 100), cex=1.5)
lines(pcnt, pred.nls, lwd = 2, lty=1, col="red", xlim=c(0,673))
lines(pcnt, pred.glm2$fit*100, lwd = 2, lty=1, col="black", xlim=c(0,673)) #$
lines(pcnt, pred.glm1$fit*100, lwd = 2, lty=1, col="green", xlim=c(0,673))

Now, I would like to know: what is the best model for my data?

  • probit
  • logit
  • nls

The logLik for the three models are:

> logLik(ddprob.nls)
'log Lik.' -33.15399 (df=3)
> logLik(ddprob.glm1)
'log Lik.' -9.193351 (df=2)
> logLik(ddprob.glm2)
'log Lik.' -10.32332 (df=2)

Is the logLik sufficient to choose the best model? (It would be the logit-model, right?) Or is there something else I need to calculate?

Tommaso
  • 563
  • 2
  • 5
  • 17
  • I have written about choosing between logit & probit [here](http://stats.stackexchange.com/questions/20523/difference-between-logit-and-probit-models/30909#30909), which you may want to read (although, `nls` is different & isn't covered there). – gung - Reinstate Monica Aug 02 '12 at 16:41
  • @gung I've previously read your great explanation there, so thanks! My problem is especially regarding the `nls` model and the comparison with `glm`. This is the reason why I (re)posted a similar question :) – Tommaso Aug 02 '12 at 16:47
  • 2
    I'm less sure about the `nls`, we'll see what people say. W/ respect to the GLiM's, I would say you should use the logit if you think your covariates connect directly to the response, & probit if you think it is mediated by a latent normally distributed variable. – gung - Reinstate Monica Aug 02 '12 at 16:51
  • @gung thanks for the suggestion! What do you think about this article? [link](http://linstat2012.au.poznan.pl/Abs/Goktas.pdf). In summary, it says: _probit model has a priority to be used for a sample size that is less than 200, whereas the Logit model is superior for a sample size that is greater than 200._ – Tommaso Aug 02 '12 at 16:55
  • It's a bit brief & it's not very clear to me what they've done (easier to read, though). I would say that if the underlying data generating process is that the data came from dichotomizing a normal distribution, then the probit is the correct model by definition, but not otherwise. In other words, the paper doesn't convince me that the standard understanding is wrong, & so I would stay w/ what I had said before. – gung - Reinstate Monica Aug 02 '12 at 17:09
  • 2
    Hi @Tommaso, I'm confused about where that rule of thumb you quoted from the article comes from, but I haven't actually clicked the link so I'll hold off on judging that. I'd say that the logistic model is nice because the coefficients have a nice interpretation - as log odds ratios. When you're trying to do variance decompositions (e.g. if you have clustered data and are trying to quantify the level of dependence within the data) the probit model has some nice properties, since the correlations on the underlying continuous (normal, as gung pointed out) scale, **are** identified. – Macro Aug 03 '12 at 14:56
  • 3
    The loglik's you get from R above are NOT comparable across different model types (they leave out constants not depending on parameters!), so are of no use to you here. – kjetil b halvorsen Aug 08 '12 at 20:30
  • @kjetilbhalvorsen ok, thanks! What about the pseudo R-squared? – Tommaso Aug 10 '12 at 05:59

1 Answers1

2

The question of what model to use has to do with the objective of the analysis.

If the objective is to develop a classifier to predict binary outcomes, then (as you can see), these three models are all approximately the same and give you approximately the same classifier. That makes it a moot point since you don't care what model develops your classifier and you might use cross validation or split sample validation to determine which model performs best in similar data.

In inference, all models estimate different model parameters. All three regression models are special cases of GLMs which use a link function and a variance structure to determine the relationship between a binary outcome and (in this case) a continuous predictor. The NLS and logistic regression model use the same link function (the logit) but the NLS minimizes squared error in the fitting of the S curve where as the logistic regression is a maximum likelihood estimate of the model data under the assumption of the linear model for model probabilities and the binary distribution of observed outcomes. I can't think of a reason why we'd consider the NLS to be useful for inference.

Probit regression uses a different link function which is the cumulative normal distribution function. This "tapers" faster than a logit and is often used to make inference on binary data that is observed as a binary threshold of unobserved continuous normally distributed outcomes.

Empirically, the logistic regression model is used far more often for analysis of binary data since the model coefficient (odds-ratio) is easy to interpret, it is a maximum likelihood technique, and has good convergence properties.

AdamO
  • 52,330
  • 5
  • 104
  • 209