13

I'm a biologist, and I have a large dataset that I'm trying to analyze. Here are the variables I'm working with:

  • levels of 211 different metabolites in 16 different blood samples (predictor variables)
  • how well each of the 16 blood samples performed in a specific test (response variable)

I am trying to figure out which variable(s) are the most important in predicting the performance of a blood sample in the test.

I would like to make these data more manageable by doing a PCA, but I'm new to this sort of analysis. I understand that a PCA will create groups of principal components (it will group metabolites that covary with each other and label each of these groups a principal component), but I'm not sure how to take into account the response variable in this analysis.

Any help would be much appreciated!!! Thank you.

> summary(metabolites_princomp)
Importance of components:
                          Comp.1     Comp.2      Comp.3      Comp.4
Standard deviation     3.9608225 0.40128486 0.259868774 0.215004349
Proportion of Variance 0.9805072 0.01006435 0.004220736 0.002889179
Cumulative Proportion  0.9805072 0.99057153 0.994792267 0.997681446
[...]
amoeba
  • 93,463
  • 28
  • 275
  • 317
Lindsay
  • 131
  • 1
  • 6
  • What language or software are you planning to work with? (It doesn't make a difference as to what PCA means but it could help shape a response) – David Robinson Jul 26 '12 at 01:20
  • I've been working in R so far, but I'm new to it. I've done a PCA on the metabolite information alone (not taking into account the response variable) and I got 16 principal components, the first of which accounts for 98% of the variance. – Lindsay Jul 26 '12 at 01:29
  • I can already tell you you forgot to center the rows of your matrix! – David Robinson Jul 26 '12 at 01:43
  • Haha, I told you I was new to this! I will do that now. – Lindsay Jul 26 '12 at 01:46
  • I usually create a function `center.rows = function(m) apply(1, function(r) r - mean(r))` – David Robinson Jul 26 '12 at 01:47
  • can I just use the function stdize to do this? – Lindsay Jul 26 '12 at 02:00
  • In the pls package? That works on the columns of the data rather than the rows. – David Robinson Jul 26 '12 at 02:01
  • @David: That will transpose the matrix in the process, so one needs to be careful. There is an easy, and slightly humorous, way to do this with a built-in `R` function; namely: `scale(X,scale=F)`. (This will center the *columns*, which is, dare I say, the more conventional layout.) – cardinal Jul 26 '12 at 02:01
  • @cardinal: that works on the columns rather than the rows, doesn't it? But I did mess up my earlier function definition: I meant to put `center.rows = function(m) t(apply(m, 1, function(r) r - mean(r)))` – David Robinson Jul 26 '12 at 02:02
  • 1
    @David: `X - rowMeans(X)` will be quite a bit more efficient if you want to center the rows. :-) – cardinal Jul 26 '12 at 02:05
  • @David: After centering the rows using your formula, I re-ran princomp and still got 16 PCs, the top one accounting for ~86% of variance – Lindsay Jul 26 '12 at 02:09
  • @cardinal: I separately tried using the built-in scale function that you suggested, re-ran the princomp and still got 16 PCs, the top one account for 98% of the variance. I'm a bit confused as to which is the appropriate one? – Lindsay Jul 26 '12 at 02:13
  • 2
    @Lindsay: Unfortunately, it is not the rows you want to be centering in your case. If you want things standardized (centered and rescaled) you can just do `princomp(X,cor=T)`. – cardinal Jul 26 '12 at 02:14
  • @Lindsay: There is always one principal component per dimension in your data. These functions are not helping you "select" a certain number to use; they are just doing a variance decomposition. :) Consider supplying the summary output in your answer. That will probably help people provide guidance. :) – cardinal Jul 26 '12 at 02:17
  • @Lindsay: That's entirely plausible. See my answer below for an explanation of how to proceed and make sense of your PCs. cardinal, thanks for the advice! – David Robinson Jul 26 '12 at 02:17
  • @DavidRobinson Princomp is calculating the eigen-decomposition of the covariance E[(X - E[X])(Y - E[Y])] (or if scaled, correlation) matrix; the data centering is implicit. I think the issue is more of scale (as pointed out one can use the cor=T option to address that) – Sameer Jul 26 '12 at 03:46

2 Answers2

10

First, note that your understanding of PCA is slightly off. PCA doesn't "group" variables into principal components. Each principal component is, rather, a new variable (a "new metabolite") of the same length as each of your original variables (in your case, 16).

It's true that each principal component can represent a group of original metabolites, but it's more complicated and sophisticated than that. Each metabolite can actually be correlated with multiple principal components, each a different amount. It could be true that a group of metabolites are purely represented principal component A and another group is purely represented by principal component B, but it is far more likely that each is correlated with multiple PCs, each to a different extent.

So think of each PC as a new metabolite (in PCA parlance we'd call it an "eigenmetabolite") that is representative of a general pattern across the metabolites. Some metabolites are highly representative of this pattern, while some aren't, and some share some properties with multiple patterns.

Now we come to your question. The way we bring in a response variable is to look at the relationship- for example, a correlation or linear regression- between each principal component (each eigenmetabolite) and the response variable. Here is a neat little example in R code. (Note that I use the svd function rather than the pls package, as you might be using).

set.seed(1337)

center.rows = function(m) t(apply(m, 1, function(r) r - mean(r)))

response.var = rnorm(16, 0, 1)

relevant.metabolites = t(replicate(50, rnorm(16, response.var, 2)))
unrelated.metabolites = t(replicate(110, rnorm(16, 0, 2)))
metabolite.data = rbind(relevant.metabolites, unrelated.metabolites)

s = svd(center.rows(metabolite.data))

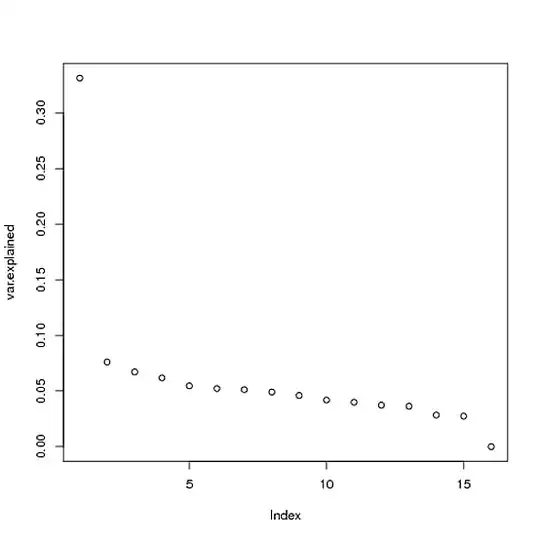
What I did is create a matrix of simulated metabolite data with 50 genes that are somewhat correlated with the response variable, and 110 genes that aren't. We can see that only one PC is significant, and it explains ~33% of the variance:

var.explained = s$d^2 / sum(s$d^2)
plot(var.explained)

enter image description here

Now let's compare that PC to the response variable:

plot(response.var, s$v[, 1])

enter image description here

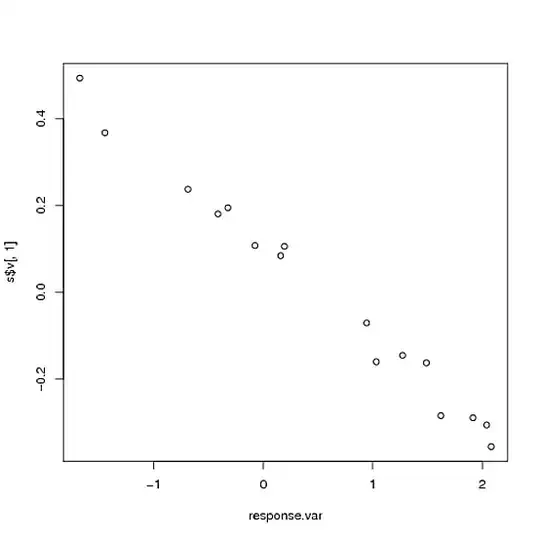
As you can see, the first PC almost perfectly recaptures the response variable that we used to create the matrix (correlation is -.993), even though we put a lot of extra noise in. (Don't worry that the correlation is negative- the direction is arbitrary). Indeed, this correlation with the "eigenmetabolite" is considerably greater than the correlation of the response variable to any of the individual significant genes:

hist(apply(relevant.metabolites, 1, function(r) cor(r, response.var)))

enter image description here

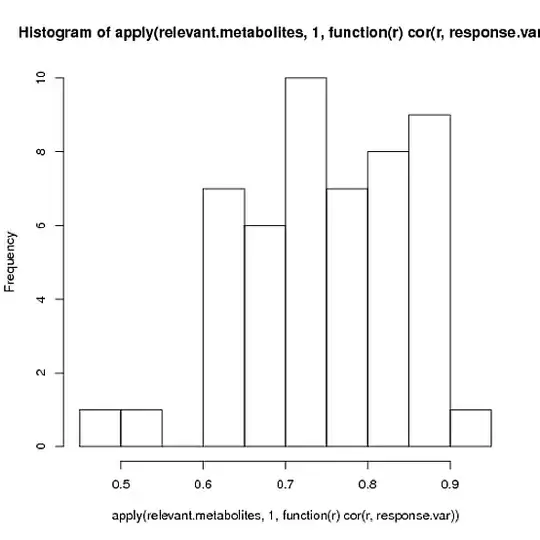
Of course, that's exactly why we're applying PCA in the first place. While the relationship between the response variable and any individual metabolite may be too weak to measure over the rest of the noise, when you combine many genes together you might find that a principal component captures that response well!

David Robinson
  • 15,190
  • 4
  • 24
  • 40
  • @ David: Thank you so much for such a detailed explanation! I'm going to give it a go right now. – Lindsay Jul 26 '12 at 02:25
  • 1
    It doesn't look like your "unrelated" metabolites are unrelated. :-) One aspect of this answer that may be misleading is that even if there were some PC associated with the response, it may not be among the ones explaining the variation in the data. So, some caution is advised. – cardinal Jul 26 '12 at 02:26
  • @David: I'm getting stuck at the step where you plot PC1 against the response variable. I have a data.frame with 212 rows and 16 columns. The last row is my response variable, so I'm typing in plot(metabolites[212,], s$v[,1]). Why won't that work for me? – Lindsay Jul 26 '12 at 02:41
  • What is your error? – David Robinson Jul 26 '12 at 02:42
  • 1
    @cardinal: right you are, that was a typo, since fixed (I'm not at a computer so I'll have to adjust the figures later in response to that change). Lindsay, what are the dimensions of your s$v matrix? – David Robinson Jul 26 '12 at 02:47
  • Error in plot.window(...) : need finite 'xlim' values In addition: Warning messages: 1: In min(x) : no non-missing arguments to min; returning Inf 2: In max(x) : no non-missing arguments to max; returning -Inf 3: In min(x) : no non-missing arguments to min; returning Inf 4: In max(x) : no non-missing arguments to max; returning -Inf – Lindsay Jul 26 '12 at 02:48
  • Ah, wait. I fixed that particular problem: I'm no longer getting an error message, but the plot looks very unlike yours. I'll try and figure out how to show it to you – Lindsay Jul 26 '12 at 02:52
  • @cardinal: my s$v matrix is 16 16 – Lindsay Jul 26 '12 at 02:56
  • Figured it out! Here is my response variable (blood) vs. PC1: http://img831.imageshack.us/img831/7061/screenshot20120725at112.png – Lindsay Jul 26 '12 at 03:28
  • You should check the correlation, and also do `cor.test` to see if it's significant. However, there are many things that that PC could be measuring. How were these 16 samples prepared- for example, were they in 2 batches of 8? Do you have any other information on the 16 samples other than the blood? – David Robinson Jul 26 '12 at 03:41
  • I will definitely try that. What other sort of information are you thinking of? As of now, all that I have are the levels of various metabolites and the response variable. I've nicknamed the response variable "blood," but it's actually a measurement of mosquito preference for each blood sample. These 16 samples were prepared in 4 batches of 4 (and I've found no affect of batch on the response variable). – Lindsay Jul 26 '12 at 03:48
  • You should check whether the batch has any relationship to the 1st PC (or to one of the other PCs that appears to be significant). `lm(s$v[, 1] ~ batch)`, for example (make sure `batch` is a factor variable). I recommend doing the same (`lm`) with the mosquito preference against each PC that appears to be significant (judged by the plot of variance explained). – David Robinson Jul 26 '12 at 04:05
  • -1. This absolutely does not answer the original question, namely "which variable(s) are the most important in predicting the [response variable]". – amoeba Feb 02 '15 at 17:10
2

After the great discussion, above, I'm hesitant to add another idea, but it seems to me that partial least squares may do what you want, more easily. I usually do this in SAS, so I don't know the details of doing it in R, but there is a PLS package that does both partial least squares regression and principal component regression.

The essential idea behind PLS is that it incorporates both relations among the independent variables and between the independent and dependent variables.

Peter Flom
  • 94,055
  • 35
  • 143
  • 276
  • Thanks for your input. I've been doing a bit of research about this today, and I was drifting towards PCR as well. I'm not sure that I quite understand PLS and PCR yet enough to be confident about executing them, but it does sound like it might make more sense considering my goals. – Lindsay Jul 26 '12 at 19:52
  • Are 'partial least squares' and 'squared partial correlation' the same thing? I'm wondering whether this is similar to Kruskal's Drivers Analysis – Mark Ramotowski Apr 20 '17 at 20:28
  • @MarkRamotowski I dont think they are teh same, but I never heard of Kruskal's drivers analysis. – Peter Flom Apr 21 '17 at 11:34
  • It's used in market research - I'm not sure how valid an approach it is if you've never heard of it! http://wiki.q-researchsoftware.com/wiki/Driver_(Importance)_Analysis#Kruskal – Mark Ramotowski Apr 21 '17 at 12:21
  • @MarkRamotowski There's a LOT of stuff I haven't heard of! I don't do market research, so, my ignorance of its methods doesn't mean much. – Peter Flom Apr 22 '17 at 12:52