1

I have a large data frame in the following form (I apologize for this formatting):

Site    Season  T          SC    pH    Chl   DO.S   DO      BGA  Tur    fDOM    Flow    Rainfall    Solar      Rain
300N    Winter  14.05   1692.77 7.93    NA  82.26   8.42    NA  9.25    NA      NA      0.00          219.18     no

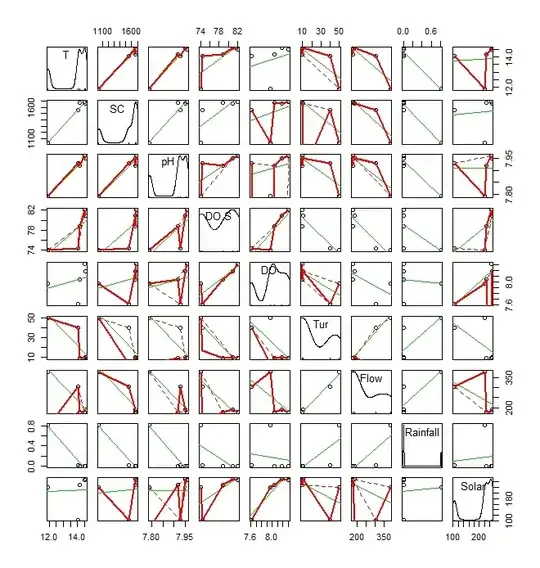
If you can't understand the formatting, there are 12 numerical factors, and 3 categorical factors (Site, Season, Rain [yes/no]). Each row represents the average daily values that I have calculated from 15-minute time series. I have spent a good amount of time doing data exploration (linear regression analysis, looking at time series plots for patterns), but haven't found a method that works for me yet. I have also worked with corrplot, correlation matrices, and covariance functions in an arduous way, where I subset each categorical combination and found corrplots for each (I have also tried it with ddply, but the resulting format is not in the correlation matrix format that is easy to plot). I have also attempted PCA on the data to little avail.

My question is first and foremost, does anyone have an idea for data visualization of this kind of dataset? The main question I am after is, "What are the factors that influence DO (dissolved oxygen)?". How does this change by location (Site), Season, and with the influence of Rain. I would really like a quick method for shooting out correlation matrices (or heat maps; I have tried both) for each categorical subset. I tried this with ggplot and facet_wrap, but it wasn't happening for me. I also tried ggpairs from the GGally package, but honestly didn't spend too much time with that method.

I was starting to get into the idea of star graphs (on polar coordinates), which can be used to visualize repeating periodicity in time series, but am running out of time and decided to seek the advisement of Stack Overflow. I really appreciate any advice or thoughts on visualizing this data that come to your mind. I feel like some combination of ddply and graphing is what I need, but I haven't gotten there yet. Thank you for your time.

EDIT: dput of the data frame in question:

structure(list(Site = structure(c(2L, 2L, 2L, 2L, 2L, 2L), .Label = c("2100S", 
"300N", "3300S", "800S", "Burnham", "Center"), class = "factor"), 
    Season = structure(c(4L, 4L, 4L, 4L, 2L, 2L), .Label = c("Fall", 
    "Spring", "Summer", "Winter"), class = "factor"), T = c(14.05, 
    14.18, 14.5, 14.58, 14.07, 11.91), SC = c(1692.77, 1671.31, 
    1680.71, 1661.79, 1549.56, 1039.63), pH = c(7.93, 7.92, 7.96, 
    7.95, 7.93, 7.79), Chl = c(NA_real_, NA_real_, NA_real_, 
    NA_real_, NA_real_, NA_real_), DO.S = c(82.26, 78.79, 82.05, 
    80.92, 74.33, 73.96), DO = c(8.42, 8.04, 8.31, 8.18, 7.61, 
    7.97), BGA = c(NA_real_, NA_real_, NA_real_, NA_real_, NA_real_, 
    NA_real_), Tur = c(9.25, 9.77, 9.41, 10.6, 40.38, 50.25), 
    fDOM = c(NA_real_, NA_real_, NA_real_, NA_real_, NA_real_, 
    NA_real_), Flow = c(NA, 178.08, 178.53, 188.13, 306.15, 382.22
    ), Rainfall = c(0, 0, 0, 0, 0.01, 0.81), Solar = c(219.18, 
    228.33, 244.3, 247.69, 105.15, 220.73), Rain = structure(c(1L, 
    1L, 1L, 1L, 2L, 2L), .Label = c("no", "yes"), class = "factor")), .Names = c("Site", 
"Season", "T", "SC", "pH", "Chl", "DO.S", "DO", "BGA", "Tur", 
"fDOM", "Flow", "Rainfall", "Solar", "Rain"), row.names = c(NA, 
6L), class = "data.frame")
Nick Stauner
  • 11,558
  • 5
  • 47
  • 105
  • Rly good to start with a question (and, an interesting one at that!). Can you do a `dput(head(…))` of the `data.frame` in question? Also, if you could post a couple snippets of what you tried with links to the graphics output (if you can't embed pictureS) that might help get what you don't like about your efforts and where folks should aim their efforts to help. – hrbrmstr Mar 25 '14 at 01:34
  • I agree the problem is interesting but it's not a good fit for SO which emphasizes problems that lend themselves to discrete coding questions. CrossValidated.com is more oriented to less well-defined questions and discussions of various methodologic approaches. – DWin Mar 25 '14 at 01:38
  • Sure thing, I will make some edits in a few moments. – user2943039 Mar 25 '14 at 01:38
  • @hrbrmstr Can you tell me how to put the dput into SO? I type dput(head(df)) in R and got an output and tried to paste it here, but it is a jumbled mess. – user2943039 Mar 25 '14 at 01:41
  • @IShouldBuyABoat Thanks for your comment, I will check that site. – user2943039 Mar 25 '14 at 01:42
  • @hrbrmstr I've added the dput – user2943039 Mar 25 '14 at 01:48
  • And, since it got migrated here (curious as to who did that and so quickly!), perhaps it might be a different application for this [CV PCA example/question](http://stats.stackexchange.com/questions/33053/incorporating-a-response-variable-in-principal-component-analysis) – hrbrmstr Mar 25 '14 at 01:56
  • Just from eye-balling the data, it looks like season influences DO. – Rich Scriven Mar 25 '14 at 01:57
  • @RichardScriven, yes indeed - season influences DO, though I'm not sure how you surmised that with just the data I have shown. Season influences DO primarily through changing solar radiation and temperature... but that is elementary. The next questions (that I am looking to answer) is how exactly does season influence DO and what other factors influence DO and how do they change with season and by location. – user2943039 Mar 25 '14 at 02:01
  • @hrbrmstr thank you very much for your help and xpost (I'm assuming it was you) – user2943039 Mar 25 '14 at 02:02
  • Have you tried really simple things like a scatterplot of DO vs. the continuous variables and boxplots of DO by the categorical? If you're interested in two variables and how they interact with DO, you can make small multiples, (facets in ggplot2), or side by side boxplots. – Ben Elizabeth Ward Mar 25 '14 at 04:02
  • @BenElizabethWard Yes I have, that is the very first thing I did. However, these variables have complex non-linear interactions with eachother so I'm looking for something else. – user2943039 Mar 25 '14 at 14:49

1 Answers1

2

Seems like kind of a tall order, but here's a whirlwind tour of R.

library(party)
library(rattle)
library(ggplot2)
library(car)

#this will expand your test set so that it is large enough to generate a tree.
DO <- rbind(DO, DO, DO, DO)
DO.ctree <- ctree(DO ~ ., data = DO, 
               controls = ctree_control(maxsurrogate = 3))
plot(DO.ctree)
#I think this answers both your "first and foremost" and your "main" questions.
#In brief: The party package helps identify which variables most influence the 
#dependent variable

ctree output

ggplot(DO, aes(factor(Season), DO)) + geom_point()
#lots of easy descriptive stats in ggplot package

dotplot from ggplot2

DO <- DO[, !sapply(DO, function (x) all(is.na(x)))]
DO.numeric <- DO[ ,sapply(DO, is.numeric)]
round(cor(na.omit(DO.numeric)), 1)
#           T   SC   pH DO.S   DO  Tur Flow Rainfall Solar
# T         1.0  1.0  1.0  0.7  0.3 -0.8 -0.9     -1.0   0.0
# SC        1.0  1.0  1.0  0.7  0.3 -0.9 -0.9     -1.0   0.1
# pH        1.0  1.0  1.0  0.7  0.3 -0.8 -0.8     -1.0   0.0
# DO.S      0.7  0.7  0.7  1.0  0.9 -0.9 -0.9     -0.6   0.7
# DO        0.3  0.3  0.3  0.9  1.0 -0.7 -0.6     -0.1   0.9
# Tur      -0.8 -0.9 -0.8 -0.9 -0.7  1.0  1.0      0.8  -0.6
# Flow     -0.9 -0.9 -0.8 -0.9 -0.6  1.0  1.0      0.8  -0.5
# Rainfall -1.0 -1.0 -1.0 -0.6 -0.1  0.8  0.8      1.0   0.1
# Solar     0.0  0.1  0.0  0.7  0.9 -0.6 -0.5      0.1   1.0
#Here's a brief corelation summary

scatterplotMatrix(na.omit(DO.numeric))
#Here's the big chart of correlations I think you requested

scatterplotMatrix

You may be interested in checking out the rattle package/GUI: it can get you off to a quick start with a lot these general questions.

Jack Ryan
  • 316
  • 2
  • 7
  • Thanks for your comment. I am checking out the ctree method right now, but need to do a little research on what the numbers actually mean. Some of your code I don't understand though (and also produces errors on my end). For instance the rbind(DO,DO,DO,DO)...why? – user2943039 Mar 25 '14 at 15:35
  • @user2943039 did this work for you? Please advise. – Jack Ryan Mar 28 '14 at 16:59