When creating a Monte Carlo simulation model for a variable, a critical step is to choose the distribution that best fits the variable's probability density.
I generally do this by looking at the density plot and determining what distribution best fits the density shape. For (a very lame) example, this…
x <- rnorm(1000)
plot(density(x))
… appears to be a normal distribution (but only because it's a random sample from the normal distribution).
However, when dealing with real world data, it's difficult to know which of the 17 built-in distributions best represent the shape of the data.
For example, this data…
data <- c(6.515, 0.243, 0.725, 2.276, 1.456, 4.047, 0.766, 0.29, 2.368,
0.543, 2.223, 0.488, 0.47, 3.511, 0.544, 4.191, 0.414, 0.704,
4.917, 0.434, 0.773, 0.477, 3.257, 0.415, 1.921, 0.278, 3.159,
4.193, 0.132, 1.109, 1.538, 4.088, 0.468, 0.047, 2.204, 3.765,
0.168, 2.231, 0.164, 0.371, 2.33, 4.458, 0.046, 1.195, 1.714,
1.046, 1.915, 2.66, 5.409, 0.466)

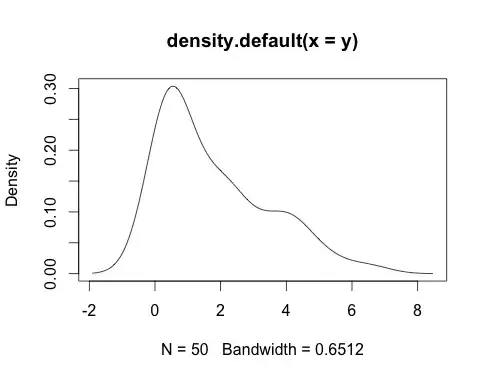
plot(density(data))

… seems like it could be best modeled with the chi-squared distribution, but it could also be a gamma distribution.
The only way I've found to fit the best type of model is to overlay a bunch of different possible distributions until I see one that visually matches (or comes close). But surely there's a more numerical, official way to do that, right?
Is there a systematic, non-visual (and automated) way to find the best distribution for a given variable? Is there a function in some R function that runs through different distributions to check their goodness of fit, or is that terribly inefficient?