25

The qqnorm() R function produces a normal QQ-plot and qqline() adds a line which passes through the first and third quartiles. What is the origin of this line? Is it helpful to check normality? This is not the classical line (the diagonal $y=x$ possibly after linear scaling).

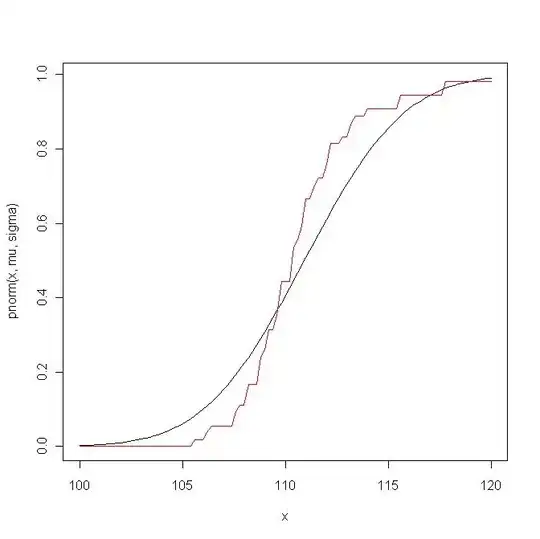
Here is an example. First I compare the empirical distribution function with the theoretical distribution function of ${\cal N}(\hat\mu,\hat\sigma^2)$: comparison of cumulative distribution functions 
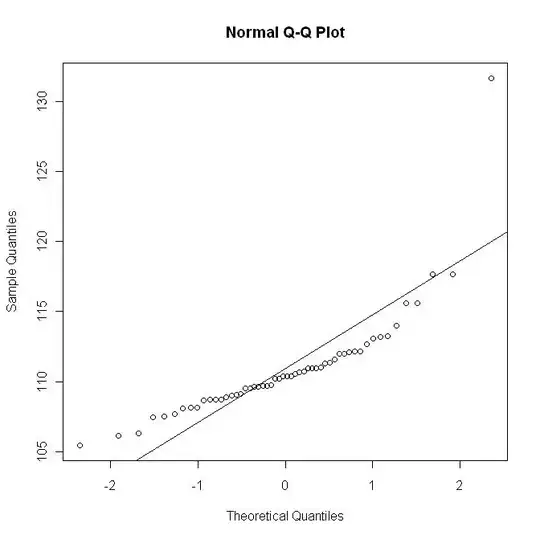
Now I plot the qq-plot with the line $y=\hat\mu + \hat\sigma x$; this graph roughly corresponds to a (non-linear) scaling of the previous graph: qqnorm along with the "good" line But here is the qq-plot with the R qqline: qqnorm and qqline 
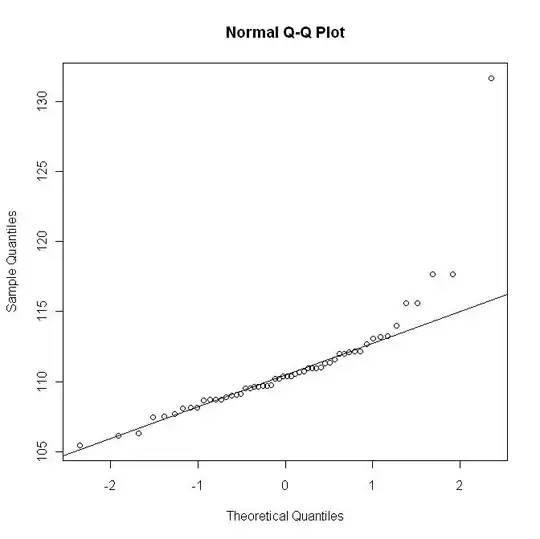
This last graph does not show the departure as in the first graph.

Glen_b
  • 257,508
  • 32
  • 553
  • 939
Stéphane Laurent
  • 17,425
  • 5
  • 59
  • 101

1 Answers1

13

As you can see on the picture,enter image description here

obtained by

> y <- rnorm(2000)*4-4
> qqnorm(y); qqline(y, col = 2,lwd=2,lty=2)

the diagonal would not make sense because the first axis is scaled in terms of the theoretical quantiles of a $\mathcal{N}(0,1)$ distribution. I think using the first and third quartiles to set the line gives a robust approach for estimating the parameters of the normal distribution, when compared with using the empirical mean and variance, say. Departures from the line (except in the tails) are indicative of a lack of normality.

Xi'an
  • 90,397
  • 9
  • 157
  • 575
  • 1
    The diagonal "after linear scaling" is here obtained by abline(mean(y), sd(y)). Here you simulate normal data hence these two lines are close. But sometimes the data is not close to a normal distribution but the qqplot is close to the qqline, but not to the diagonal "after scaling". – Stéphane Laurent Feb 04 '12 at 11:45
  • ... I'm going to add an example to my question – Stéphane Laurent Feb 04 '12 at 11:53
  • 4
    I think this was my point in stating that using the quartiles is more robust than using empirical mean and variance. – Xi'an Feb 04 '12 at 14:56
  • Ok - I see. My third graph corresponds (roughly) to the comparison of the empirical distribution function with the theoretical distribution function ${\cal N}(\hat\mu, \hat\sigma)$ but with other estimates $\hat\mu$ and $\hat\sigma$: those based on the first and third quartiles. Right ? – Stéphane Laurent Feb 04 '12 at 15:51
  • Yes, the estimates $\hat \mu$ and $\hat \sigma$ are the "best" for a normal sample but are highly sensitive to ab-normality, contrarywise to quartiles... – Xi'an Feb 04 '12 at 16:19
  • 1
    Ok, thank you very much. Now this seems obvious. The qqline could be preferable because sometimes in practice the non-normality in the tails is acceptable. But there is no real need to plot the qqline: a visual check is sufficient - the only thing we need is to understand the QQ-plot :) – Stéphane Laurent Feb 04 '12 at 16:25
  • Your link doesn't work ! – Stéphane Laurent Feb 04 '12 at 18:09
  • A graph only gives an impression, though, not a quantitative analysis of the discrepancy. Things like [Kolmogorov Smirnov tests](http://stats.stackexchange.com/a/22205/7224) can provide some kind of quantitative analysis (with their own caveats!) – Xi'an Feb 04 '12 at 18:13
  • 1
    Ok - I tag, but the answer itself was not satisfactory: the answer together with our discussion is ; but this is my fault: my question was not clear before I add the example. By the way my question is somewhat related to the KS-test: what about the choice of the estimates $\hat\mu$ and $\hat\sigma$ when we type ks.test(x,"pnorm",mu.hat,sigma.hat) ? – Stéphane Laurent Feb 04 '12 at 19:04
  • This is the point of the discussion of [the above post](http://stats.stackexchange.com/a/22205/7224). The p-value has to be computed by Monte Carlo and it also depends [theoretically and practically] on the choice of those estimates $\hat\mu$ and $\hat\sigma$. – Xi'an Feb 04 '12 at 19:08
  • 1
    Yes, but there's no proposal of a "good" choice in the discussion. Don't the values of $\hat\mu$ and $\hat\sigma$ minimizing ks.test(x,"pnorm",mu.hat,sigma.hat) seem to be a more natural choice ? This sounds like Bayesian intrinsic inference : inference based on a distance between the distributions, not between parameters of the distributions. – Stéphane Laurent Feb 04 '12 at 19:20
  • Interesting point: there is a theory of [minimum chi-square estimation opposed to maximum likelihood](http://projecteuclid.org/DPubS?service=UI&version=1.0&verb=Display&handle=euclid.aos/1176345003)... This choice would still require Monte Carlo evaluation to calibrate the ks.test, though. – Xi'an Feb 04 '12 at 19:41
  • let us [continue this discussion in chat](http://chat.stackexchange.com/rooms/2386/discussion-between-xian-and-stephane-laurent) – Xi'an Feb 04 '12 at 19:41