3

Basically, I'm just trying to plot a curve over my histogram for the weight of a few students.

 lines(density(weight), lwd = 2, col = "red")

However, what I get is a line on the bottom of the graph. I suppose the density has to be such that the integral of the curve is 1. What command should I be using instead of density, if I want to have a fitting curve for the histogram?

Glen_b
  • 257,508
  • 32
  • 553
  • 939
Qwertford
  • 275
  • 3
  • 9

1 Answers1

8

The problem is that a density and the usual frequency (i.e. count) histogram aren't on the same scale (i.e. at heart this isn't an R problem, it's a problem that a count histogram isn't a legitimate density).

Typically, a density has area 1, but a histogram has area $n$. This kind of problem would occur any time you compared things with different area.

[Edit: I was thinking of a histogram like this, where the count is definitely represented by area, but A.Donda is quite right to point out in comments that R's hist doesn't do that*; it represents count by height and so the area is of the histogram will be $n\times$ the binwidth ($b$, say). *(and indeed more generally it's very common that people define the count in relation to the heights of the histogram rather than in terms of area. My desire to call that a bar chart doesn't change what the hist command does, for example). So consequently, in many cases the area will actually be $nb$, as it is here.]

To make them comparable, you will either need to scale your histogram to have area 1 (making the histogram into a density-estimate, the solution I would suggest), or you need to scale your density to have area $n$ (at which point it's no longer a density of course, but is at least something comparable to the frequency histogram).

(An easy way to achieve the first in R is just to use freq=FALSE in your call to hist)

There's an example of the resulting comparison (having the two displays both be valid densities) in this post:
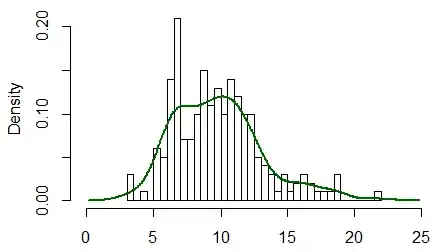
hist and kde for gamma(10) r.v., n = 200

Glen_b
  • 257,508
  • 32
  • 553
  • 939
  • To be pedantic, a histogram has area $n \Delta$, where $\Delta$ is the bin width. – A. Donda Aug 27 '15 at 16:45
  • @A.Donda That's not correct, because the histogram's area depends on the heights. Otherwise it would be practically useless! – whuber Aug 27 '15 at 17:07
  • @whuber, a single histogram bar has a height $c_i$ and a width $\Delta$; its area is therefore $c_i \Delta$. The total area of all bars is therefore $\sum_i c_i \Delta = n \Delta$ if the sample size is $n = \sum_i c_i$. The heights are implicit in $n$. – A. Donda Aug 27 '15 at 17:10
  • @Glen_b, I'm just thinking practically; apart from the neat R-specific solution that you gave, if one wants to scale a histogram to match a density or vice versa, one has to take into account both sample size and bin width. In the case of variable width, $\Delta$ would be the weighted average of bin widths. – A. Donda Aug 27 '15 at 17:12
  • 1
    @A.Donda You're right to point out that my answer was inadequate. I've made an edit; hopefully that's sufficient. Sorry to have deleted my comment; if I'd realized you were replying to it I'd have left it there. – Glen_b Aug 27 '15 at 17:23
  • @A.Donda The correct definition of a probability histogram is that its total area is unity; for a frequency histogram, the total area is the total count. The bars on a histogram are not required to have equal width. These two points are at the root of most of the confusion expressed in questions about histograms. The formula "$n\Delta$" clarifies neither of these issues, nor is it consistent with the definitions. – whuber Aug 27 '15 at 18:35
  • @A.Donda I haven't said you're confused. I just think your comments aren't as helpful as you would like them to be. Wikipedia will work just fine for definitions. Another good source is Freedman, Pisani, Purves, *Statistics* (any edition since the first in 1978). – whuber Aug 27 '15 at 19:22
  • @whuber, after reading Glen_b's edit I finally understand what you are getting at. If the histogram is already constructed such that the count is represented the by area and not by height, then you are right. In that case of course the vertical axis is already a "count density", and for matching with a probability density you only need to divide by $n$. However, the question quite clearly is about the result of R's (or Matlab's) `hist`, which is not a count density but a simple count. Moreover, almost all the histograms that I've come across in my career showed counts and not count densities. – A. Donda Aug 27 '15 at 19:28
  • 1
    Regarding helpfulness, right back at you: You could have simply pointed out that in your understanding (backed by standard textbooks, I get it) a histogram shows count densities on the vertical axis, and all this back and forth could have been avoided. – A. Donda Aug 27 '15 at 19:29