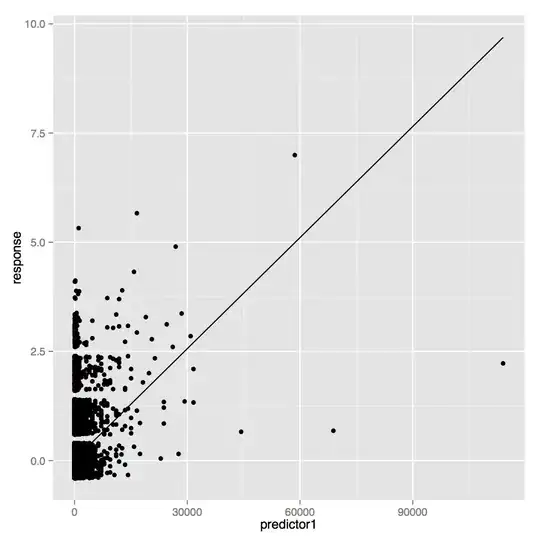
I drew a histogram of my data:
Totalclaims<-replicate(Number,simulateclaims())
v<-sort(Totalclaims)
hist(v, main = "Distribution of total claims", xlab = "simulated number of claims in next 12 months",
ylab = "Frequency", breaks = seq(6050,6650,l=100))
and when I tried to add the density curve:
lines(density(v), col = "black", lwd = 2)
