10

Imagine a situation: We have historical records (20 years) of three mines. Does the presence of silver increases the probability of finding gold in next year? How to test such question?
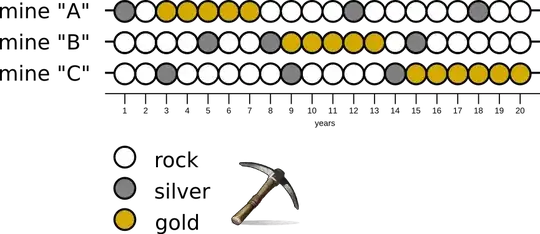

enter image description here

Here is example data:

mine_A <- c("silver","rock","gold","gold","gold","gold","gold",
            "rock","rock","rock","rock","silver","rock","rock",
            "rock","rock","rock","silver","rock","rock")
mine_B <- c("rock","rock","rock","rock","silver","rock","rock",
            "silver","gold","gold","gold","gold","gold","rock",
            "silver","rock","rock","rock","rock","rock")
mine_C <- c("rock","rock","silver","rock","rock","rock","rock",
            "rock","silver","rock","rock","rock","rock","silver",
            "gold","gold","gold","gold","gold","gold")
time <- seq(from = 1, to = 20, by = 1)

kjetil b halvorsen
  • 63,378
  • 26
  • 142
  • 467
Ladislav Naďo
  • 2,202
  • 4
  • 21
  • 45
  • 1
    You may be interested in calculating [transition matrices](http://stats.stackexchange.com/questions/26722/calculate-transition-matrix-markov-in-r). – Andy W Apr 27 '15 at 11:54
  • Hi @AndyW! Thank you for comment. I am familiar with transition matrices package:makkovchain - markovchainFit(). May I use the probability values from transition matrix as p-values? Is there any way how to test hypothesis: "There exist a "silver-gold" relationship." (p-value = xx)? – Ladislav Naďo Apr 27 '15 at 12:10
  • 1
    @LadislavNado transition probabilities cannot be interpreted as p-values (they do not tell you anything about rejecting any H0), see http://stats.stackexchange.com/questions/31/what-is-the-meaning-of-p-values-and-t-values-in-statistical-tests for learning more on p-values. – Tim Apr 27 '15 at 12:58
  • Thank you @Tim for your comment. You confirmed my doubts. – Ladislav Naďo Apr 27 '15 at 13:08
  • You are probably looking for [Anderson & Goodman (1957)](http://projecteuclid.org/euclid.aoms/1177707039). – tchakravarty Apr 27 '15 at 15:59
  • 1
    I see a problem with the way you have extracted your data. Consider your "silver: no" & "gold: yes" scenario, you should also be counting your consecutive runs of "gold" since that meets the logic criteria. –  Apr 27 '15 at 16:05
  • 1
    With the one cell corrected from 1 to 14, the model changes to: Coefficients: Estimate Std. Error z value Pr(>|z|) (Intercept) -1.2528 0.8018 -1.562 0.118 as.factor(c(0, 1))1 0.3655 0.8624 0.424 0.672 –  Apr 27 '15 at 16:27
  • Thank you @leonardo. Your comment was crucial for obtaining a valid result. – Ladislav Naďo Apr 27 '15 at 17:09
  • This is a great question, but it's giving me nightmare flashbacks to my stochastic processes class in college. – shadowtalker Apr 29 '15 at 15:58

1 Answers1

4

My best try: ...usage of transition matrices suggested by @AndyW is probably not the solution I am looking for (based on @Tim's comment). So I've tried a different approach. I found this link which deals with how to do logistic regression where response variable y and a predictor variable x are both binary.

According to example I should create 2 × 2 table based on my data:

               gold (yes)  gold (no)
silver (yes)       2           7
silver (no)       14          34

How I extracted the values: enter image description here

And construct a model:

response <- cbind(yes = c(2, 14), no = c(7, 34))

mine.logistic <- glm(response ~ as.factor(c(0,1)),
                      family = binomial(link=logit))

summary(mine.logistic)
# Coefficients:
#                     Estimate Std. Error z value Pr(>|z|)
# (Intercept)          -1.2528     0.8018  -1.562    0.118
# as.factor(c(0, 1))1   0.3655     0.8624   0.424    0.672

Is it a good solution? Does the p-value (0.673) mean that presence of silver no not increase the probability of finding gold?

Ladislav Naďo
  • 2,202
  • 4
  • 21
  • 45
  • How did you generate these nice charts? Tikz? – shadowtalker Apr 29 '15 at 15:59
  • Hi @ssdecontrol! Charts were made by hand in Inkscape. – Ladislav Naďo Apr 29 '15 at 16:00
  • Yes, that's a decent interpretation. Also, if you just look at the rows of your 2x2 table, on the top row (silver: yes) you have 9 cases, 2 of which had gold, so given silver probability of gold next year is 2/9 = 0.222. On the bottom row (silver: no) you have 48 cases, 14 of which had gold next year, so given no silver probability of gold is 14/(14+34) = 0.292. Given all that, it looks like silver *hurts* your chance of finding gold, though from your p-values not "statistically significantly". – Gregor Thomas Apr 29 '15 at 16:39
  • Also be mindful of your coding, you start with `yes = c(2, 14), no = c(7, 34)`, which means your putting Silver:yes first. So when you do `as.factor(c(0, 1))` the 0 corresponds to silver: yes, which is your reference level and thus your intercept. The 0.67 p-value corresponds to the small positive bump you get in probability of finding gold moving from silver:yes to silver:no. – Gregor Thomas Apr 29 '15 at 16:42
  • One last comment: you *are* using transition matrices. Your 2, 7, 14, 34 matrix is a transition matrix. – Gregor Thomas Apr 29 '15 at 16:43