I'm running PCA on my dataset which can be found here. There are 6497 instances and 12 attributes with 13th column is the class (ranging from 3 - 9) for wine quality.
I've read what PCA is supposed to do. It combines attributes and shows variance in the data. Finally leading to be able to select few dimensions from a high dimension data that have the most variance.
I'm having trouble finding which attributes to pick after running PCA. How can I find out which attributes can I use and still not lose meaning of my data.
I've created the following biplot from the ggbiplot package
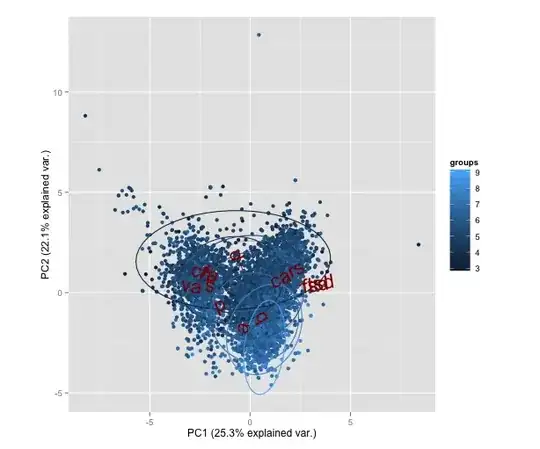
How can I interpret from this biplot which attributes to pick?
I've also created a screeplot for variance.
Looking at the variance screeplot I would say that 3 components would represent the data well. Is this a reasonable assessment to make?
Question
- How can I decide which attributes to pick after running PCA
- While doing PCA should I leave out the class variable or keep it?
Code to generate the plots
wine <- read.csv("wine_nocolor.csv")
wine1 <- wine[2:13]
wine1.pca <- prcomp(wine1, scale. = TRUE)
library(devtools)
install_github("ggbiplot", "vqv")
ggbiplot(wine1.pca, obs.scale = 1, var.scale = 10, groups = wine$q, ellipse = TRUE, circle = TRUE, title="Biplot for Wine Quality (PC1, PC2)", var.axes=TRUE, varname.size=8)