3

This is related to my questions here and here. I am still struggling with my model, so I am taking it back to basics.

My assertion is simple, I believe that watershed runoff will have a different relationship with precipitation depending on if the soil water table reaches a threshold. The soil water table is a function of antecedent water table, precipitation, and a scaling parameter (soil porosity, essentially) $watertable = antecedent + C*Pcp$. So,

$$Runoff = \begin{cases} f_1(Pcp) & \text{if $(Ant + C*Pcp) < Thold$;}\\ f_2(Pcp) & \text{if $(Ant + C*Pcp) \geq Thold$;} \end{cases}$$

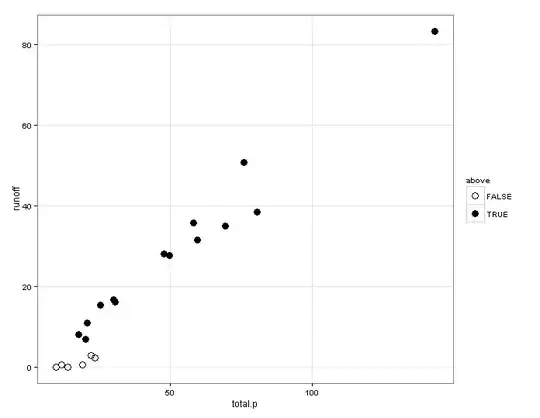
As a first approximation, I think both $f_1$ and $f_2$ are linear in $Pcp$ (see figure below). I am trying to construct a model that would allow me to test for the existence of this threshold effect. It seems to me that I should test this model against two competing models

  1. $runoff = f(Pcp)$
  2. $runoff = f(Pcp)$ with a breakpoint in $Pcp$

So, two questions:

  1. Does this seem like an appropriate way to test for the effect I described above?
  2. How would I go about fitting and calculating statistics for my full model above? In particular estimating the parameters and determining AIC and $r^2$ values. I am familiar with the segmented package in R, but not sure if it can be used here. Again, from looking at the data it seems that the regressions are linear, but if the method could be easily extended to other relationships that would be interesting.

Thank you for reading all this, it has been driving me nuts and I hope to get it resolved.

edit: An important point that I did not mention: If possible, I would like to derive the parameters $C$ and $Thold$ from the data. Estimation of $Thold$ is more interesting from a scientific point; I could pre-suppose $C$ based on some physical data, but would be curious to try and derive it as well.

runoff v. precip, points colored by a priori $ant + c*pcp > thold$

Iceberg Slim
  • 261
  • 2
  • 11

1 Answers1

1

1. Yes, this seems reasonable in general. Not knowing the details of your research, I am hesitant to say it is specifically appropriate.

2. I am a fan of the hinge function and nonlinear least squares for a change in slope model:

$$y = \beta_{0} + \beta_{x}x + \beta_{c}\max{(x-{\theta},0)}+\varepsilon$$

This models fixed parameters:

  • $\beta_{0}:$ the constant term, also the $y$-intercept

  • $\beta_{x}:$ the change in $y$ given a 1-unit increase in the value of $x$

  • $\beta_{c}:$ the change in the slope of $x$ at the value of $x=\theta$

  • $\theta:$ the value of $x$ at which the slope changes by $\beta_{c}$

The value of $\max{(x-\theta,0)}$ is 0 below $x=\theta$ (hence the slope of the line describing $y$ as a function of $x$ is simply $\beta_{x}$ below $x=\theta$), and above that point the slope of the line describing $y$ as a function of $x$ is $\beta_{x} + \beta_{c}$. Note: at the point $x=\theta$ exactly there is no slope.

If you are interested in inferring whether your data support a change in slope, you will want to look at the CI or $p$-value of $\theta$.

Edit: Of course, what you propose is a bit fancier, as $\theta$ is not simply some constant. So:

$$Runoff = \beta_{0} + \beta_{Pcp}Pcp + \beta_{c}\max{[Pcp−(Ant+C\times Pcp),0]}+\varepsilon$$

Here $\theta = Ant+C \times Pcp$, and $C$ is a parameter to be estimated.

Edit: To incorporate an interaction with a dichotomous term, say $z$, so that the change in slope only occurs for $z=1$ I would use this model, which assumes that the regression line is the same for $z=0$ and $z=1$ below $\theta$:

$$y = \beta_{0} + \beta_{x}x + \beta_{c}z\max{(x-{\theta},0)} +\varepsilon$$

If you want to permit the $y$-intercept to vary depending on $z$, then:

$$y = \beta_{0} + \beta_{x}x + \beta_{c}z\max{(x-{\theta},0)} + \beta_{z}z +\varepsilon$$

And if you want a completely separate slope of $x$ estimated when $z=1$:

$$y = \beta_{0} + \beta_{x}x + \beta_{c}z\max{(x-{\theta},0)} + \beta_{z}z + \beta_{xz}xz +\varepsilon$$

You can estimate nonlinear least squares regression models using nls in R, using nl in Stata, etc.

Bonus: You can include more than one hinge function if the slope changes more than once, as in:

$$y = \beta_{0} + \beta_{x}x + \beta_{c1}\max{(x-\theta_{1},0)} + \beta_{c2}\max{(x-\theta_{2},0)} +\varepsilon$$

Alexis
  • 26,219
  • 5
  • 78
  • 131
  • Thank you for your reply. It seems like this hinge method is similar / the same to how the segmented package implements it? Two questions I have are: 1) how would you estimate the CI for $\theta$ and 2) In my model formulation, the threshold is not a value of the predictor variable alone ($Pcp$), but rather of its interaction with another variable ($Ant$) and an estimated parameter ($C$). It's likely I am missing the obvious, but how would those be included in the model fitting? – Iceberg Slim Mar 25 '15 at 20:15
  • @IcebergSlim I am not familiar with the `segmented` package. Nonlinear least squares packages tend to report Wald-type confidence intervals for parameter estimates (e.g. $\theta \pm t_{\alpha/2}s_{\theta}$). I will edit to include a model with interaction. – Alexis Mar 25 '15 at 20:26
  • @IcebergSlim I have edited to provide you with a few different models that vary depending on the assumptions you want to make. Feel free to click the up-arrow if you find my answer useful, and to click the check mark if you find my answer the best. – Alexis Mar 25 '15 at 20:34
  • Ah, something I neglected. I edited my question to include an important point which I had neglected: I hope to derive both $Thold$ and $C$ from the data; $Thold$ in particular I would like to derive. Thanks again for your time, – Iceberg Slim Mar 25 '15 at 20:57
  • I'm afraid the trouble is that $Thold$ is in a different variable than $Pcp$ (or $x$, in your formulation). This is a central part to my analysis: I propose that the response of $ruonff$ to $precip$ will vary _at the same value of $precip$_ depending on weather or not $antecedent + C*precip$ is above $Thold$, this can be seen in the figure above. Perhaps I am being obtuse, but it seems like the $\theta$ above will introduce a breakpoint in the predictor variable $x$ (or in my model, $Pcp$). My apologies if I am being dense, I like math but my stats abilities are modest. – Iceberg Slim Mar 25 '15 at 22:14
  • Let us [continue this discussion in chat](http://chat.stackexchange.com/rooms/22283/discussion-between-iceberg-slim-and-alexis). – Iceberg Slim Mar 25 '15 at 22:22
  • @IcebergSlim Not sure I follow. From the title of your question, you were asking about a 'simple' breakpoint model. I do not particularly care what you want to label $x$, my point is that *if* you want to model a change in a linear relationship between two variables, you can do so using the model I propose. *If* you want to differentiate that change by group, you can do so using my edit. $Ant+C∗Pcp$ does not seem to make much sense to me, since it implies the point at which the slope of the $y$ vs. $x$ line changes *varies* across values of $x$ (which implies a curve not a linear breakpoint). – Alexis Mar 25 '15 at 22:25
  • First of all, I do not mean to impose on your time, so feel free to bail on the discussion when you like. I suppose simple may have been a misnomer. $Ant + C*Pcp$ is because I propose a physical threshold in the soil profile: if there is enough precipitation to raise the water table above this, you get runoff. The amount of precipitation needed to reach the threshold depends on the antecedent water table the pororsity of the soil. Perhaps a segmented linear regression is not the best way to ask this question, in which case I will reframe it again. Thanks again for your time – Iceberg Slim Mar 25 '15 at 22:39
  • @IcebergSlim Sure. Also, lightbulb: a model like $runoff = \beta_{0} + \beta_{Pcp}Pcp + \beta_{c}\max{[Pcp - (Ant + C\times Pcp),0]} + \varepsilon$ is possible with nonlinear least squares. Here "$C$" is the parameter, and $Ant$ is some observed variable, with the breakpoint in the line being defined by $(Ant + C\times Pcp)$ – Alexis Mar 25 '15 at 22:55
  • That looks very promising. I will take some time to try and wrap my head around it, then I will probably pop up on Stack Overflow to try and figure out how to implement it in R. Thanks for all your help. – Iceberg Slim Mar 25 '15 at 23:42