11

I am looking to group/merge nodes in a graph using graph clustering in 'r'.

Here is a stunningly toy variation of my problem.

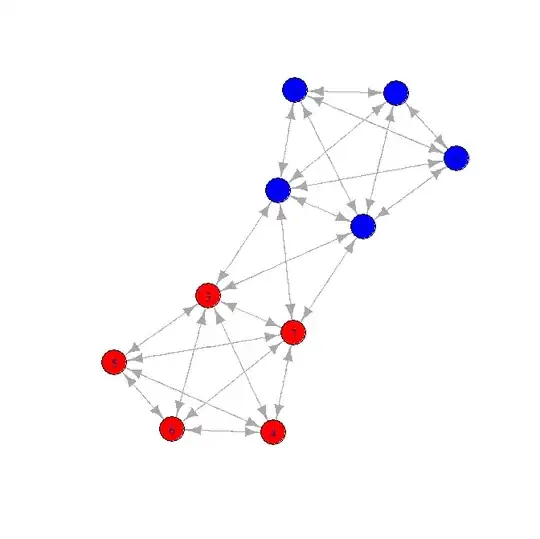
  • There are two "clusters"
  • There is a "bridge" connecting the clusters

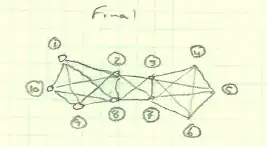
Here is a candidate network:
enter image description here

When I look at the connection distance, the "hopcount", if you will, then I can get the following matrix :

 mymatrix <- rbind(
     c(1,1,2,3,3,3,2,1,1,1),
     c(1,1,1,2,2,2,1,1,1,1),
     c(2,1,1,1,1,1,1,1,2,2),
     c(3,2,1,1,1,1,1,2,3,3),
     c(3,2,1,1,1,1,1,2,3,3),
     c(3,2,1,1,1,1,1,2,2,2),
     c(2,1,1,1,1,1,1,1,2,2),
     c(1,1,1,2,2,2,1,1,1,1),
     c(1,1,2,3,3,2,2,1,1,1),
     c(1,1,2,3,3,2,2,1,1,1))

Thoughts here:

  • By luck or due to the simplicity of the toy the matrix has obvious patches this is not going to be the case in the (very large) matrix. If I randomized the relationship between point and row then it would not be so clean.
  • I might have got one wrong - so if I have a typo, let me know.
  • Hop-count here is shortest number of hops to connect point on row i with point on column j. A self-hop is still a hop, so the diagonal is all ones.

So in this matrix larger distance (hops) has a higher number. If I wanted a matrix showing "connectivity" instead of distance, then I could do a dot-inverse, where each cell of the matrix is replaced with its multiplicative inverse.

Questions:

To help me find my own way:

  • What are the terms for reducing the number of nodes on a graph by combining them? Is it clustering, merging, munging - what are the words that I should use?
  • What are the proven techniques? Is there a textbook on the topic? Can you point to papers or websites?
  • Now I tried to look here first - it is a great "first check" spot. I didn't find what I was looking for. If I missed it (not unlikely) can you point me to an answered question or two on the topic here at CV?

To get me where I am going:

  • Is there an 'R' package that will properly cluster the nodes on the network?
  • Could you point me to example code to do this?
  • Is there an 'R' package that will graphically present the resulting reduced network?
  • Could you point me to example code to do this?

Thanks in advance.

EngrStudent
  • 8,232
  • 2
  • 29
  • 82
  • "Community detection" is a term that you will be interested in. [Here](http://stackoverflow.com/a/12699979/604456) is an example in R. – Andy W Feb 26 '15 at 20:57
  • 2
    Please be aware that asking for (R) packages or code are off-topic here. You may want to make the "find" portion more prominent & the "get" portion less so. – gung - Reinstate Monica Feb 26 '15 at 21:03
  • @AndyW, given that the on-topic portion of this question is the name of the analysis & some references, why not develop your comment into an official answer? – gung - Reinstate Monica Feb 26 '15 at 21:04
  • 3
    I will attempt to make a full answer sometime when I get a chance @gung. But for a quick answer [here is the community detection](https://dl.dropbox.com/s/qni08af2kag5j6q/Comm_Detection.R?dl=0) applied to the example graph of EngrStudent using the R `igraph` package. – Andy W Feb 26 '15 at 21:22
  • 1
    IMHO there is only one cluster in this graph. There are, however, three overlapping **cliques**. I don't know why your plan is to destroy the middle clique - unless you can formalize this, you'll have a hard time finding an algorithm. – Has QUIT--Anony-Mousse Feb 27 '15 at 07:30
  • @gung - I did not know it was off topic, and will adjust my question. Looking for the right statistical tool for an extremely specialized statistical and numeric task was what I assumed CV was best at. I can point it at StackOverflow - but I do not expect the knowledge or capability there. Anony-Mousse I am looking to aggregate based on higher connectivity. I'm looking to transform to a clique-map from an individual relationship map. – EngrStudent Feb 27 '15 at 13:22
  • @AndyW - Please submit for answer. Fell free also to point to references on "community detection". This was exactly what I needed - just knowing the package name and commands does a ton. Thank you. – EngrStudent Feb 27 '15 at 13:27
  • I was going to recommend `igraph` as well, but I'll let AndyW type it up. As comments have said, your example is a tough case, since you show three cliques joined together. – Wayne Feb 27 '15 at 13:30
  • 2
    For what it's worth, mcl (http://micans.org/mcl/) finds the two clusters (I don't really agree with Anony-Mousse's assessment, and I don't find the clique-modeling approach to graph clustering particularly fruitful). This is with its single parameter (controlling granularity) set to default. This algorithm (mcl - I published it) is used quite widely in bioinformatics, and (highly scalable) source code is available. Interfacing with R is easily done using text interfaces. – micans Feb 27 '15 at 15:57
  • The 'cliques' joined together argument does not hold water. Any two cliques for which a triangle stradles the two clusters can also be said to be three cliques joined together. In fact, a single edge can be said to be a clique. In the example, if the 5-cliques are changed to 10-cliques, the implied statement "overlapping cliques cannot be split in clusters" becomes a bit silly. The example perhaps invites these doubts (by using 5-cliques and a 4-clique), but the doubts do not really stand up to scrutiny. – micans Feb 27 '15 at 16:24
  • 2
    Asking for code & packages has essentially always been off-topic here. Asking for help w/ existing code (ie you have a [reproducible example](http://stackoverflow.com/q/5963269/1217536)) is on-topic on [SO]. If you didn't know this, it's time to learn it. The idea that the users answering R Qs on SO don't have statistical expertise is weird to me, but many people seem to assume that; at any rate it is not true. That your Q was answered by a SO post should say something here. OTOH, saying 'what kind of analysis is this, can someone point me to resources' is definitely on-topic here. – gung - Reinstate Monica Feb 27 '15 at 16:51
  • @gung - the boxes are inside the mind. There are two separate box models - the one presented by the on-topic guidelines, and the one in the mind of the user. There are however many users in many modes. Maybe one day machine learning will get it right. Until then we have rules. – EngrStudent Feb 27 '15 at 20:30
  • @gung - I guess that comment falls into the pragmatics subset of semiotics. http://en.wikipedia.org/wiki/Semiotics – EngrStudent Mar 03 '15 at 21:18

3 Answers3

11

Your particular example suggests finding communities within the network that have more connections between nodes in the community and relatively few edges between nodes in different communities. This is distinct from finding isolated communities, in which there are subgraphs that are completely disconnected.

Here is an example of community detection in R using the igraph package and an algorithm described in Clauset et al. (2004). To use this algorithm I turn your "hop count" into a binary adjacency matrix with no self loops. The algorithm needs an undirected matrix, which is consistent with your hand written diagram and the data you provided (the edges are symmetric).

library(igraph)
mymatrix <- rbind(
     c(1,1,2,3,3,3,2,1,1,1),
     c(1,1,1,2,2,2,1,1,1,1),
     c(2,1,1,1,1,1,1,1,2,2),
     c(3,2,1,1,1,1,1,2,3,3),
     c(3,2,1,1,1,1,1,2,3,3),
     c(3,2,1,1,1,1,1,2,2,2),
     c(2,1,1,1,1,1,1,1,2,2),
     c(1,1,1,2,2,2,1,1,1,1),
     c(1,1,2,3,3,2,2,1,1,1),
     c(1,1,2,3,3,2,2,1,1,1))

#turn this into an adjacency matrix
adjMat <- mymatrix == 1
diag(adjMat) <- 0 #no self loops

g  <- graph.adjacency(adjMat)
plot(g)

#only works for undirected graphs, which this example is fine since symetric
fc <- fastgreedy.community(as.undirected(g))

#make colors for different communities
V(g)$color <- ifelse(membership(fc)==1,"red","blue")
plot(g)

enter image description here

I can not comment on the appropriateness of collapsing such nodes for further analysis, but such community detection is definitely useful for exploring the network. There are plenty of other community detection algorithms as well (as well as other libraries for network analysis in R). This is just one example that happens to produce your desired output for this toy problem.

Andy W
  • 15,245
  • 8
  • 69
  • 191
  • 1
    Also given the previous comments about using a graph database, you *do not need* to have the graph represented as an adjacency matrix. A table for the nodes and a row for each edge is a more typical/efficient format, and you can turn that into an `igraph` network. – Andy W Mar 03 '15 at 14:34
2

For future readers,

Here is a set of functions from the igraph packages and the last one is from MCL:

print("LABEL PROPAGATION")
w<-cluster_label_prop(g)

print("Leading Eigen")
w<-cluster_leading_eigen(g)

print("SpinGlass")
w<-cluster_spinglass(g, stop.temp = 0.05)

print("walktrap")
w<-cluster_walktrap(g, steps=4)

print("MCL")
adj<-get.adjacency(g)
w<-mcl(adj,addLoops=TRUE)

You can find the documentation here http://igraph.org/r/doc/ and here https://cran.r-project.org/web/packages/MCL/MCL.pdf

I find walktrap particularly useful

asac
  • 197
  • 1
  • 1
  • 14
  • Although this may be related to the question it does not seem to be an answer. – Michael R. Chernick Mar 22 '18 at 16:35
  • 2
    i answered the two questions : Is there an 'R' package that will properly cluster the nodes on the network? Could you point me to example code to do this? But yes, It does not answer the whole set of questions. – Omar Jaafor Mar 22 '18 at 16:50
1

If you are not already wedded to a repository for your node and connection data, you might look at the Rneo4j package. But this implies use of the neo4j (a graph database, not a RDBMS) to store your data. I'm no expert here, but I do think this approach might be especially effective if a) as suggested by Anony-Mousse, you cannot formalize this, or b) the number of nodes and connections is especially large, or c) you wind up having additional questions regarding your network.

  • I did not know such a thing existed. Neat! Is this a decent example of the material? http://nicolewhite.github.io/RNeo4j/examples/ – EngrStudent Feb 27 '15 at 20:31
  • How would one go from data in neo4j to graph-clustering? Would mcl or igraph work with it? – EngrStudent Mar 02 '15 at 16:38
  • 2
    Once you have pulled your data from neo4j into R, you can use any other R package (e.g., AndyW suggests igraph) against the data. Alternatively - the Rneo4j package includes commands for retrieving data, and also allows you to run the Cypher query language (analogous to SQL, but custom-built for the neo4j graph db). In Cypher, you can do sophisticated queries and run some predefined algorithms (Shortest paths, all paths, all simple paths, Dijkstra, etc.). I'm at my limit here in both characters and content - If you want to go down this path (sorry!), the neo4j site might be your next stop. – user3123116 Mar 03 '15 at 20:24