I am using crost() function of R for analyzing and forecasting intermittent demand/slow
moving items time series. I am having difficulty in understanding the output. Could anyone help in understanding the model in layman's terms.
Below is the code and output of the model:
v <- c(1910,874,1920,350,160,685,0,0,0,0,0,0,0,0,0,0,0,0,0,0,0,0,0,0,0,0,0,0,0,0,0,0,0,0,0,0,0,0,0,0,0,0,176,0,16,826,0,66,3798,800,1274,638,192,160,0,0,0,0,0,0,0,
0,0,0,0,0,0,0,0,0,0,0,0,0,0,0,0,0,0,0,0,0,0,0,0,0,0,0,0,0,28,0,0,276,0,0,1072,80,1776,240,80,528,3081,566,1483,112,272,120,0,0,0,
0,0,0,0,0,0,0,0,0,0,0,0,0,0,0,0,0,0,0,0,0,0,0,0,0,0,0,0,0,0,0,0,160,0,808,0,0,608,0,1480,184)
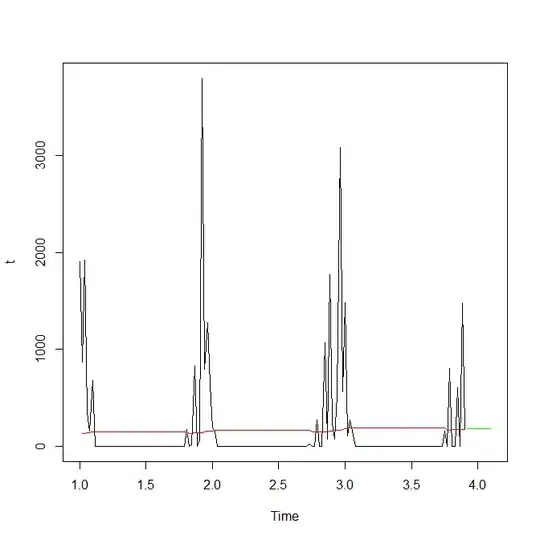
t <- ts(v, f=52)
x<-crost(t,h=52)
x
I have read the document of the Package ‘tsintermittent’, but still did not get what are weights, frc.in, frc.out. I would like to discuss this on thread as I am totally new to this method.