I have a matrix of 336x256 floating point numbers (336 bacterial genomes (columns) x 256 normalized tetranucleotide frequencies (rows), e.g. every column adds up to 1).
I get nice results when I run my analysis using principle component analysis. First I calculate the kmeans clusters on the data, then run a PCA and colorize the data points based on the initial kmeans clustering in 2D and 3D:
library(tsne)
library(rgl)
library(FactoMineR)
library(vegan)
# read input data
mydata <-t(read.csv("freq.out", header = T, stringsAsFactors = F, sep = "\t", row.names = 1))
# Kmeans Cluster with 5 centers and iterations =10000
km <- kmeans(mydata,5,10000)
# run principle component analysis
pc<-prcomp(mydata)
# plot dots
plot(pc$x[,1], pc$x[,2],col=km$cluster,pch=16)
# plot spiderweb and connect outliners with dotted line
pc<-cbind(pc$x[,1], pc$x[,2])
ordispider(pc, factor(km$cluster), label = TRUE)
ordihull(pc, factor(km$cluster), lty = "dotted")
# plot the third dimension
pc3d<-cbind(pc$x[,1], pc$x[,2], pc$x[,3])
plot3d(pc3d, col = km$cluster,type="s",size=1,scale=0.2)
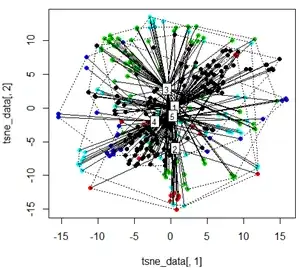
But when I try to swap the PCA with the t-SNE method, the results look very unexpected:
tsne_data <- tsne(mydata, k=3, max_iter=500, epoch=500)
plot(tsne_data[,1], tsne_data[,2], col=km$cluster, pch=16)
ordispider(tsne_data, factor(km$cluster), label = TRUE)
ordihull(tsne_data, factor(km$cluster), lty = "dotted")
plot3d(tsne_data, main="T-SNE", col = km$cluster,type="s",size=1,scale=0.2)
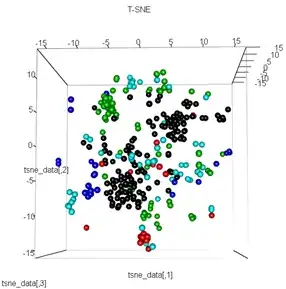
My question here is why the kmeans clustering is so different from what t-SNE calculates. I would have expected an even better separation between the clusters than what the PCA does but it looks almost random to me. Do you know why this is? Am I missing a scaling step or some sort of normalization?