2

My problem is the very idea of how to start the analysis of 2D point patterns, specifically how to find linear trends within their spatial pattern.

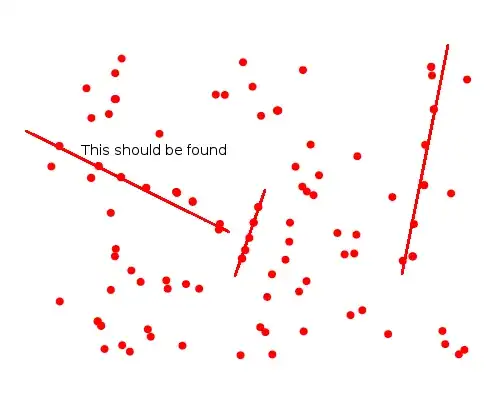
I have XY data points which are organized like in the plot, which I have manually marked with red lines in order to highlight what should be determined:

enter image description here

This post suggests the use of kernel density estimation (which is the usual method I guess), but I would like to find out if there is any simpler way of doing this, avoiding the use of spatial statistics. R solution is preferred.

UPDATE:

When using the solution suggested by whuber (Hough transform) I get these lines as the most frequent ones in my scatterplot:

enter image description here

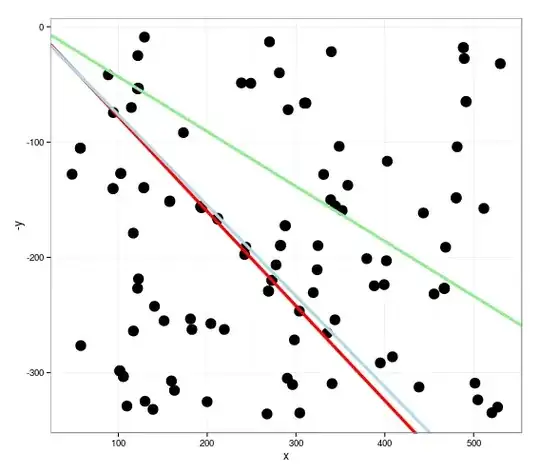
Obviously these are not the lines I was searching for, but nevertheless it would be interesting to determine the very points that lie on the red line, for example.

Fedja Blagojevic
  • 587
  • 3
  • 14
  • I'm not sure why the "This should be found" line doesn't continue to the bottom right of the graph. – Roland Aug 29 '14 at 12:29
  • It can continue in a linear regression fashion I guess, but the point is that only the points that are directly on it should be detected. If too long it may include more points further down to the bottom right. – Fedja Blagojevic Aug 29 '14 at 12:57
  • For additional solutions, please see http://stats.stackexchange.com/questions/109819 and http://stats.stackexchange.com/questions/33078. – whuber Aug 29 '14 at 14:40
  • Yes I have looked at the solutions proposed, but I`m still slightly unsure how to detect precisely which points share a linear trend, since they may not lie in a perfectly straight line? Otherwise the usage of Hough transform is a great idea. Thanks. – Fedja Blagojevic Aug 31 '14 at 08:25

0 Answers0