26

I was using the Linear Discriminant Analysis (LDA) from the scikit-learn machine learning library (Python) for dimensionality reduction and was a little bit curious about the results. I am wondering now what the LDA in scikit-learn is doing so that the results look different from, e.g., a manual approach or an LDA done in R. It would be great if someone could give me some insights here.

What's basically most concerning is that the scikit-plot shows a correlation between the two variables where there should be a correlation 0.

For a test, I used the Iris dataset and the first 2 linear discriminants looked like this:

IMG-1. LDA via scikit-learn

enter image description here

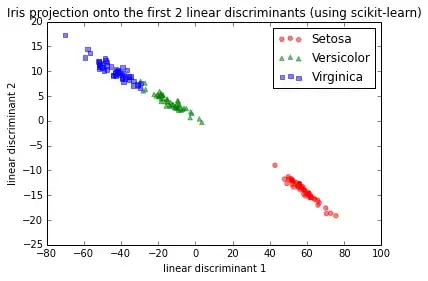
This is basically consistent with the results I found in the scikit-learn documentation here.

Now, I went through the LDA step by step and got a different projection. I tried different approaches in order to find out what was going on:

IMG-2. LDA on raw data (no centering, no standardization)

enter image description here

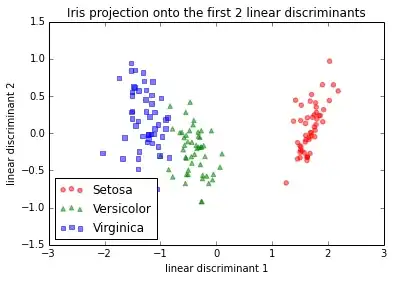
And here would be the step-by-step approach if I standardized (z-score normalization; unit variance) the data first. I did the same thing with mean-centering only, which should lead to the same relative projection image (and which it indeed did).

IMG-3. Step-by-step LDA after mean-centering, or standardization

enter image description here

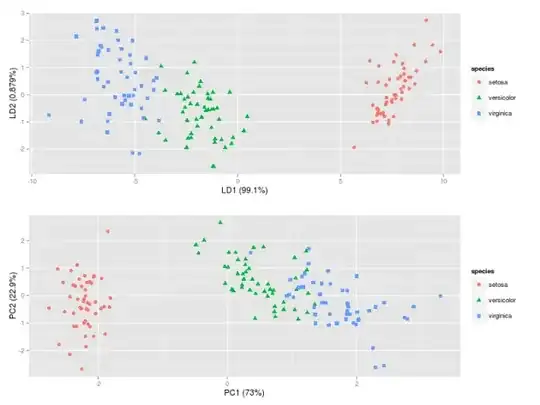
IMG-4. LDA in R (default settings)

LDA in IMG-3 where I centered the data (which would be the preferred approach) looks also exactly the same as the one that I found in a Post by someone who did the LDA in R enter image description here


Code for reference

I did not want to paste all the code here, but I have uploaded it as an IPython notebook here broken down into the several steps I used (see below) for the LDA projection.

  1. Step 1: Computing the d-dimensional mean vectors $$\mathbf m_i = \frac{1}{n_i} \sum\limits_{\mathbf x \in D_i}^n \; \mathbf x_k$$
  2. Step 2: Computing the Scatter Matrices

    2.1 The within-class scatter matrix $S_W$ is computed by the following equation:
    $$S_W = \sum\limits_{i=1}^{c} S_i = \sum\limits_{i=1}^{c} \sum\limits_{\mathbf x \in D_i}^n (\mathbf x - \mathbf m_i)\;(\mathbf x - \mathbf m_i)^T$$

    2.2 The between-class scatter matrix $S_B$ is computed by the following equation:
    $$S_B = \sum\limits_{i=1}^{c} n_i (\mathbf m_i - \mathbf m) (\mathbf m_i - \mathbf m)^T$$ where $\mathbf m$ is the overall mean.

  3. Step 3. Solving the generalized eigenvalue problem for the matrix $S_{W}^{-1}S_B$

    3.1. Sorting the eigenvectors by decreasing eigenvalues

    3.2. Choosing k eigenvectors with the largest eigenvalues. Combining the two eigenvectors with the highest eigenvalues to construct our $d \times k$-dimensional eigenvector matrix $\mathbf W$

  4. Step 5: Transforming the samples onto the new subspace $$\mathbf y = \mathbf W^T \times \mathbf x.$$

amoeba
  • 93,463
  • 28
  • 275
  • 317
  • I haven't gone through to look for the differences, but you can see exactly what scikit-learn is doing [in the source](https://github.com/scikit-learn/scikit-learn/blob/master/sklearn/lda.py). – Danica Jul 28 '14 at 19:52
  • It looks like they are also standardizing (centering and then scaling via division by the standard deviation). This, I would expect a result similar to the one in my 3rd plot (and the R) plot...hmm –  Jul 28 '14 at 20:15
  • Weird: the plot you obtained with scikit (and the one they show in their documentation) does not make sense. LDA always yields projections that have correlation zero, but obviously there is a *very strong* correlation between scikit's projections on discriminant axes 1 and 2. Something is clearly wrong there. – amoeba Jul 28 '14 at 21:52
  • @ameoba Yes, I think so too. What's also weird is that the same plot I am showing for scikit is in the example documentation: http://scikit-learn.org/stable/auto_examples/decomposition/plot_pca_vs_lda.html That makes me think that my usage of scikit it correct, but that there is something odd about the LDA function –  Jul 28 '14 at 21:59
  • @SebastianRaschka: Yes, I noticed. It is weird indeed. However, notice that the first of your own (non-scikit) LDA plots also shows non-zero correlation and hence something must be wrong with it as well. Did you centre the data? Projection on the second axis does not seem to have zero mean. – amoeba Jul 28 '14 at 23:04
  • I believe it is the effect of the scaling of the axes on the first pic. If you pull the pic up/down to add it much more height, you'll see the same as on the other pics. I expect. It is probable that scikit makes some (unnecessary) scaling of discriminant scores to the eigenvalues (which are very different for the two discriminants in your case). – ttnphns Jul 28 '14 at 23:06
  • I'm not R user, but I think the only original, correct R output among the two is the second one (Pic No.3). Variables centered or standardized, no matter, the pic should be the same. Discriminants as variables are centered and uncorrelated. Pic No.2 looks like Pic No.3 to which constants (levels) were added, different for different groups. – ttnphns Jul 28 '14 at 23:16
  • @ttnphns: But surely no amount of scaling can turn zero correlation into strong correlation! – amoeba Jul 28 '14 at 23:24
  • @amoeba, Discriminant scores are uncorrelated only when they are displayed properly, i.e. with data cloud centered. Pic No.2 is strange. Was there different shifts applied to the classes by by Y axis, or was there some sort of rotation? I don't know (and wouldn't care much). – ttnphns Jul 28 '14 at 23:39
  • @amoeba, it really can be rotation (plus constand addition). Results are sometimes rotated in LDA. I just did the analysis in SPSS with varimax rotation of the coefficients; and the plot of the scores look quite similar to the OP's. – ttnphns Jul 28 '14 at 23:51
  • Thanks for all your comments. I thought that it would be easiest to add descriptive headings to the images where everyone can see it. This should also answer the question about standardization and centering :). @ameoba It would be great if you could add the SPSS results as 5th image to as edit to my question or as a separate answer. I think that would be very helpful for this discussion –  Jul 29 '14 at 00:04
  • @SebastianRaschka, I had shown LDA of iris data results, obtained in SPSS, here: http://stats.stackexchange.com/a/83114/3277 – ttnphns Jul 29 '14 at 08:12
  • @SebastianRaschka, regarding your second figure: I don't think it makes any sense to project the data without centring it first. The LDA axes are found via covariance matrices, and the means are subtracted to compute them. So you should also subtract the means before projecting the data (standardizing is optional though, that is another issue). I would replace your Figure 2, if I were you. Regarding the scikit analysis, we should contact the developers and ask them (or look in the code). I might do it later. I am sure it is *not* about varimax rotation, btw. – amoeba Jul 29 '14 at 09:06
  • @SebastianRaschka: Also, I found your question on StackOverflow. Cross-posting is [very much discouraged](http://meta.stackexchange.com/questions/64068) on the StackExchange network. Please consider either removing one of your questions, or modifying one of them so that they are not almost identical anymore. Maybe you can leave this question as is (i.e. about which analysis is correct) and phrase the one on StackOverflow as a short bug report (consisting of the first paragraphs, Figure 1, and a link here)? Just an idea. – amoeba Jul 29 '14 at 09:10
  • Note that there is also a visualization issue in this figure! So, within-class correlation in linear discriminants should be minimal! And this property is satisfied although it may look that LD1 & LD2 are correlated for each class, but they are not! It's just that LD1 has 5 times higher range than LD2 so class distributions don't look spherical! – Vahid Mirjalili Jul 29 '14 at 14:09
  • @VahidMir: I am not sure I understand what you mean. If a distribution is spherical then after scaling it might look elliptic, but *not diagonally stretched*! There certainly *is* a correlation between LD1 and LD2 within each class on Figure 1. – amoeba Jul 29 '14 at 14:38
  • @ameoba: I changed the post on StackOverflow entirely now. I cross-posted it initially because I thought that the audience might be a largely different one: statisticians, machine learning people here, and more programmers on StackOverflow: I didn't know that it was discouraged and I will definitely refrain from cross posting in future. –  Jul 29 '14 at 15:29
  • For convenience: here is [the StackOverlow discussion](http://stackoverflow.com/questions/25003427). – amoeba Jul 30 '14 at 15:31
  • As an update in 2018 - there is still an open bug with the Sklearn implementation in the case of more than 2 classes. https://github.com/scikit-learn/scikit-learn/issues/6848 And I am not getting the right results for 3 classes on the IRIS dataset. – Xavier Bourret Sicotte Jun 18 '18 at 13:32

2 Answers2

20

Update: Thanks to this discussion, scikit-learn was updated and works correctly now. Its LDA source code can be found here. The original issue was due to a minor bug (see this github discussion) and my answer was actually not pointing at it correctly (apologies for any confusion caused). As all of that does not matter anymore (bug is fixed), I edited my answer to focus on how LDA can be solved via SVD, which is the default algorithm in scikit-learn.


After defining within- and between-class scatter matrices $\boldsymbol \Sigma_W$ and $\boldsymbol \Sigma_B$, the standard LDA calculation, as pointed out in your question, is to take eigenvectors of $\boldsymbol \Sigma_W^{-1} \boldsymbol \Sigma_B$ as discriminant axes (see e.g. here). The same axes, however, can be computed in a slightly different way, exploiting a whitening matrix:

  1. Compute $\boldsymbol \Sigma_W^{-1/2}$. This is a whitening transformation with respect to the pooled within-class covariance (see my linked answer for details).

    Note that if you have eigen-decomposition $\boldsymbol \Sigma_W = \mathbf{U}\mathbf{S}\mathbf{U}^\top$, then $\boldsymbol \Sigma_W^{-1/2}=\mathbf{U}\mathbf{S}^{-1/2}\mathbf{U}^\top$. Note also that one compute the same by doing SVD of pooled within-class data: $\mathbf{X}_W = \mathbf{U} \mathbf{L} \mathbf{V}^\top \Rightarrow \boldsymbol\Sigma_W^{-1/2}=\mathbf{U}\mathbf{L}^{-1}\mathbf{U}^\top$.

  2. Find eigenvectors of $\boldsymbol \Sigma_W^{-1/2} \boldsymbol \Sigma_B \boldsymbol \Sigma_W^{-1/2}$, let us call them $\mathbf{A}^*$.

    Again, note that one can compute it by doing SVD of between-class data $\mathbf{X}_B$, transformed with $\boldsymbol \Sigma_W^{-1/2}$, i.e. between-class data whitened with respect to the within-class covariance.

  3. The discriminant axes $\mathbf A$ will be given by $\boldsymbol \Sigma_W^{-1/2} \mathbf{A}^*$, i.e. by the principal axes of transformed data, transformed again.

    Indeed, if $\mathbf a^*$ is an eigenvector of the above matrix, then $$\boldsymbol \Sigma_W^{-1/2} \boldsymbol \Sigma_B \boldsymbol \Sigma_W^{-1/2}\mathbf a^* = \lambda \mathbf a^*,$$ and multiplying from the left by $\boldsymbol \Sigma_W^{-1/2}$ and defining $\mathbf a = \boldsymbol \Sigma_W^{-1/2}\mathbf a^*$, we immediately obtain: $$\boldsymbol \Sigma_W^{-1} \boldsymbol \Sigma_B \mathbf a = \lambda \mathbf a.$$

In summary, LDA is equivalent to whitening the matrix of class means with respect to within-class covariance, doing PCA on the class means, and back-transforming the resulting principal axes into the original (unwhitened) space.

This is pointed out e.g. in The Elements of Statistical Learning, section 4.3.3. In scikit-learn this is the default way to compute LDA because SVD of a data matrix is numerically more stable than eigen-decomposition of its covariance matrix.

Note that one can use any whitening transformation instead of $\boldsymbol \Sigma_W^{-1/2}$ and everything will still work exactly the same. In scikit-learn $\mathbf{L}^{-1}\mathbf{U}^\top$ is used (instead of $\mathbf{U}\mathbf{L}^{-1}\mathbf{U}^\top$), and it works just fine (contrary to what was originally written in my answer).

amoeba
  • 93,463
  • 28
  • 275
  • 317
  • 1
    Thanks for this nice answer. I appreciate it that you took the time to write it up that nicely. Maybe you could mention it in the discussion on GitHub; I am sure that would be of help to fix the LDA in the next version of sci-kit –  Aug 05 '14 at 15:07
  • @SebastianRaschka: I don't have an account on GitHub. But if you want, you can give there a link to this thread. – amoeba Aug 05 '14 at 15:17
  • @amoeba: Textbooks usually describe the LDA as you did - an eigenvalue decomposition of $\boldsymbol \Sigma_W^{-1} \boldsymbol \Sigma_B$. Curiously, a number of LDA implementations I know take a different approach. Their axes are the vectors to the class means transformed with $\boldsymbol \Sigma_W^{-1}$. Your LDA solution is an orthonormal basis of these vectors. Scikit-learn's LDA gives the same results as these implementations, so I don't think there is actually an error. – MB-F Aug 06 '14 at 07:38
  • For reference, here are the implementations I was talking about: http://sourceforge.net/p/mlpy/code/ci/default/tree/mlpy/da.py#l24 https://github.com/sccn/BCILAB/blob/master/code/machine_learning/ml_trainlda.m http://www.mathworks.com/matlabcentral/fileexchange/29673-lda--linear-discriminant-analysis – MB-F Aug 06 '14 at 07:41
  • @kazemakase: Can you point me to any authoritative treatment of LDA explaining such an approach (textbook, paper, slides, whatever)? I have seen dozens of LDA treatments and they were all equivalent to the standard approach. If there are any advantages in doing LDA differently, I would love to know them. Code examples are not convincing, as they are (a) not authoritative, and (b) fail to explain any rationale. [Also: class means transformed with $\boldsymbol\Sigma_W^{-1}$ is yet another approach, different from scikit's? Does not involve svd/eig at all? Probably works for two classes only.] – amoeba Aug 06 '14 at 09:28
  • @amoeba: May I refer you to Fisher's 1938 paper [here](http://digital.library.adelaide.edu.au/dspace/bitstream/2440/15227/1/138.pdf)? Although only the two-class case is discussed, generalization to more classes is straight forward. SVD/EIG is not used at all, and the advantage is that you don't need an estimate of $\boldsymbol \Sigma_B$, which is often underdetermined. – MB-F Aug 06 '14 at 12:49
  • 2
    @kazemakase: Well, of course if there are only two classes, then $\boldsymbol \Sigma_B$ has rank 1, and everything simplifies a lot, as the only eigenvector of $\boldsymbol \Sigma_W^{-1}\boldsymbol \Sigma_B$ is given by $\boldsymbol \Sigma_W^{-1}(\boldsymbol\mu_1 - \boldsymbol\mu_2)$, where $\boldsymbol\mu_i$ are class means. I guess that is what you meant before? This is nicely covered e.g. in Bishop's ML textbook, section 4.1.4. But the generalization to more classes requires eigen-analysis (Ibid., 4.1.6). Also, scikit's code (that we are discussing here!) *does* use svd, twice actually. – amoeba Aug 06 '14 at 13:45
3

Just to close this question, the discussed issue with the LDA has been fixed in scikit-learn 0.15.2.