I need an advice/ best method on how to rigorously test the influence of categorical predictors (states), or their duration (duration of war/peace in this case) on time series.
How to prove that the increase in prices of oil is caused by war? I would like to get some p-value.
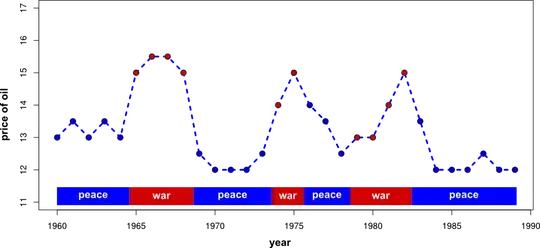
# Example - influence of war on prices of oil
# (completely speculative of course ;D)
price <- c(13,13.5,13,13.5,13,15,15.5,15.5,15,12.5,12,12,12,12.5,14,15,
           14,13.5,12.5,13,13,14,15,13.5,12,12,12,12.5,12,12)
year <- seq(from = 1960, length = 30)
era <- rep(c("peace","war","peace","war","peace","war","peace"),
             times = c(5,4,5,2,3,4,7))
my.data <- data.frame(price = price, year = year, era = era)

# plot
plot(my.data$year, my.data$price, xlab = "year", ylab = "price of oil",
     pch = 20, ylim = c(11,17), cex = 2.2)
lines(my.data$year, my.data$price, col = "blue", lty = 2, lwd = 2)
Can anybody help me? Thank you for any guidance in advance! At least the name of appropriate technique will be helpful.
 . TH Actaul and Fitted values are graphed here
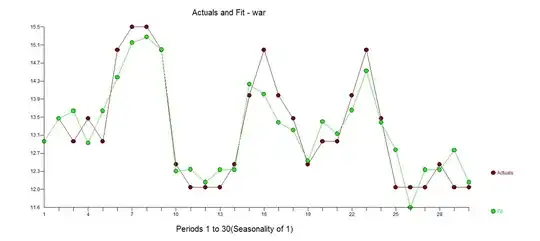 . Th residual plot does not indicate non-randomness
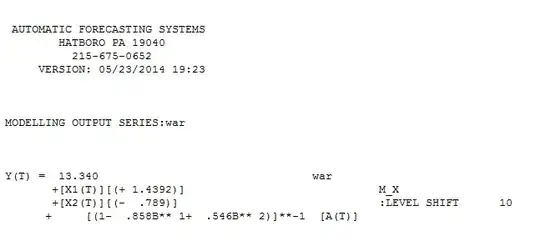
 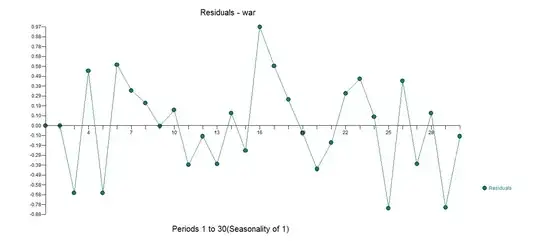 . The equation incorporates memory an an identified level shift at period 10 while suggesting a significant effect of the ear variable to be +1.4392 . The full reporting of the statistical model is
 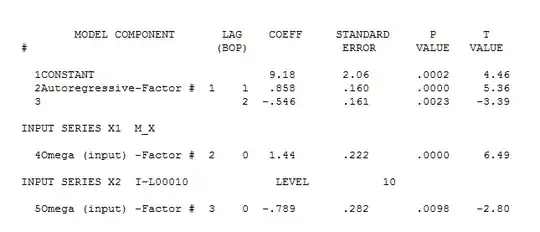 and
and 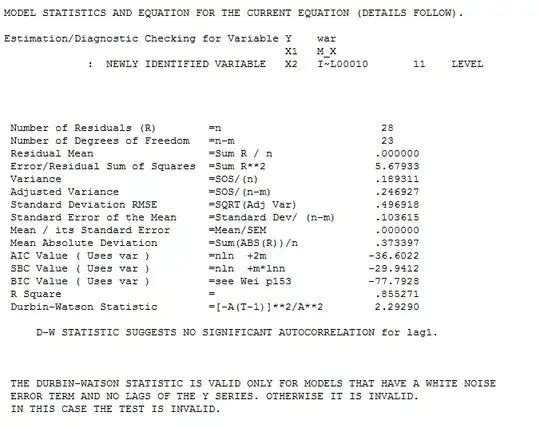 . The P value for the war indicator is close to 0.0 . The method used here was to form a regression model between y and x and then identify the need for the level shift indicator reflecting an unspecified event. Additionally the error structure suggested non-randomness necessitating augmenting the model with an arima process of order (2,0,0)(0,0,0) . In this way the resultant error process is rendered Gaussian and the tests of significance become meaningful
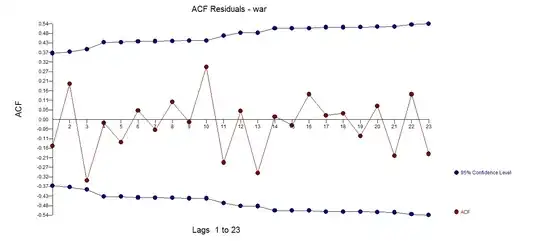 .
.