1

I have fitted my stress-strain data with $y=ax^3+bx^2+cx+d$ and also added tangent lines as shown in figure below. I am interested to see the deviation of the fit from the linearity. I am not aware of any theory that can be used to find the tangent point (the point of deviation of the fit from the linearity). Hence, based on my visual inspection I somewhat decided my tangent point at added vertical lines. This method is of course raising question of reliability. So I am looking for suggestions how I can quantitively determine the points of deviation for all four data sets.

Your advice/suggestion would be highly appreciated!

enter image description here

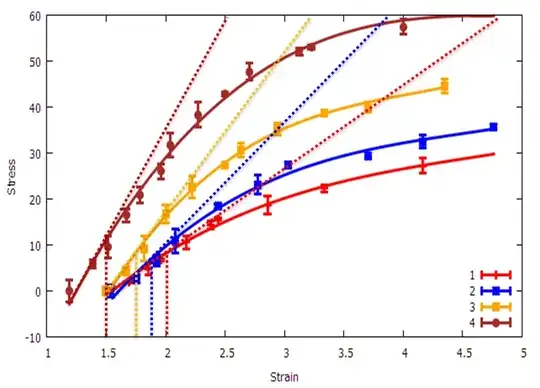
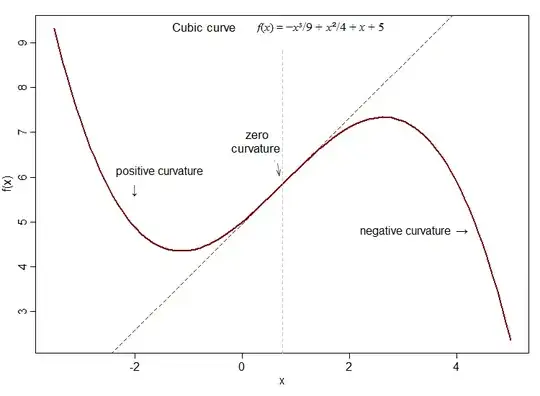
Question update: The figure shows that there is a linear relationship at the beginning, but at some point (point of deviation from linearity), the linear relationship disappears and non-linear relationship prevails. I'm looking for a way to determine this point of deviation from linearity quantitatively, not as done by visual inspection. How do I do that?

(Sorry, not sure what should be the appropriate tag for this post!)

Stat
  • 7,078
  • 1
  • 24
  • 49
orthopolis
  • 171
  • 1
  • 9
  • Do you know for a fact that it's linear and then changes? Otherwise I think that's too strong a claim. Anything sufficiently smooth will look linear on a short enough interval interval. – ekvall May 14 '14 at 04:10
  • @Karl, yes it is linear in the beginning and then nonlinear. – orthopolis May 14 '14 at 09:20

1 Answers1

4

If you're asking about where the point of inflexion is on the cubic, it's where $\frac{d^2y}{dx^2}=6ax+2b$ is zero, which occurs when $x = -b/3a$.

enter image description here

However a fitted model doesn't give you the exact (population) values of $a$ and $b$, just noisy estimates, so you are left to estimate that point.

This is a very similar problem to finding the turning point on a quadratic fit, which has been discussed in a number of posts here. Some of these posts will have some useful information, particularly if you want a confidence interval for the point of inflexion.

For example, see here and a related question here.

Finding the turning point in a logistic model is another common problem on CV which has a number of relevant posts. These can be found with a suitable search.

--

It's not clear that cubics are a good choice of model for this situation, unless you really expect the relationship to reach a maximum and then come back down again as Strain increases further:

enter image description here

If you don't expect that, I'd suggest considering functions that more nearly accord with the physical expectations of the behaviour.

(Perhaps the aforementioned logistic model may be of some relevance to you, I don't know.)


Response to updated question:

The figure shows that there is a linear relationship at the beginning, but at some point (point of deviation from linearity), the linear relationship disappears and non-linear relationship prevails. I'm looking for a way to determine this point of deviation from linearity quantitatively, not as done by visual inspection. How do I do that?

If you fit, say a nonlinear logistic model, the inflexion point in the logistic is a parameter of the model. If you fit some other model it will depend on the model.


If you really think it's linear for an initial period (rather than just close to linear), you might fit a function that is literally linear and then joins up to a function that has no curvature at the join point, and the same slope, akin to the left end of a natural cubic spline where the knot is a parameter, but instead with a function on the right that flattens out/asymptotes.

Glen_b
  • 257,508
  • 32
  • 553
  • 939
  • Thanks Glen for your comment. After your comment now I'm also interested to get the CI for the "point of inflection". However, my interest is not in the point of inflection (sign change), but the tangent point where the curve deviates from the linearity. – orthopolis May 13 '14 at 18:27
  • As for the relationship, it reaches the peak (plateau) and stays there. – orthopolis May 13 '14 at 18:30
  • @orthopolis, what you actually have is an issue of understanding the mathematics of including a cubic polynomial in your model. There is no " tangent point where the curve deviates from the linearity". Your entire function is a cubic polynomial. In addition, your actual relationship may reach a plateau & stay there, but your model will not, as Glen_b notes, thus your model would be misspecified. You may need to work w/ a statistical consultant. – gung - Reinstate Monica May 13 '14 at 19:21
  • The point of inflexion is the one point on the cubic curve where the second derivative is 0 -- i.e. where it doesn't curve (it's right there in the name: "point of inflexion" == "point where it doesn't flex" ... that is, where it's straight); that's really the only point on a cubic curve where it makes sense to talk about it being "linear". If you mean somewhere else, you will have to define what you mean. Please clearly define your terms (preferably algebraically). – Glen_b May 13 '14 at 21:36
  • @orthopolis If the relationship doesn't come back down, but either reaches or simply approaches a maximum, you should fit a curve that behaves that way. There are many such curves; I mentioned the logistic curve, which is widely used, but there are other choices depending on your needs. Please see my additional information relating to the cubic in my answer. – Glen_b May 13 '14 at 23:36
  • @gung, Thanks gung for pointing out the diff between the physical and math model as mentioned by Glen. – orthopolis May 14 '14 at 06:39
  • @Glen, Many thanks Glen, after your explanation, I realised that cubic fit was not the right one as it differed significantly with the physical model when extended to higher value. I am yet to try f(x)=1/(1+e^x) as my logistic equation and report it – orthopolis May 14 '14 at 06:48
  • 1
    You'd fit something like $E(Y) = \frac{\theta}{1+\exp(-\{a+bx\})}$. – Glen_b May 14 '14 at 06:50
  • @Glen, if you take any of the four data sets, you will notice that at the beginning the relationship is linear (for example red), the gradient is either constant of increasing until x=2 for red, beyond this point the gradient decreases and for x>4, it reaches the plateau. What I understand that in my case, for any data set, there exists a point, which has the maximum slope representing the point of deviation from linearity. I was wondering if there is any formula to determine this maximum slope. Hope it is a bit clear now. Thanks. – orthopolis May 14 '14 at 07:02
  • So wait - linear, then positive curvature, then back to negative curvature - that is a lot to put on the first half a dozen points (before it starts to flatten out). You don't really have enough data to fit completely separate curves to each with enough precision to pick up all of that. You might be able to do it with a cubic function (with the cubic term having the opposite sign to before) inside a logistic, but a total of 5 parameters (counting the final level) is really a lot. – Glen_b May 14 '14 at 09:11
  • No, it's linear and then curvature before it flattens out.there is no negative curvature. The demarcating point between even the linear and curvature has the maximum slope in the entire population. – orthopolis May 14 '14 at 09:24
  • Thanks for the logistic fit equation. I'll try it and report it here. – orthopolis May 14 '14 at 09:30
  • Let me quote you: "*the gradient is either constant of increasing until x=2 for red, beyond this point the gradient decreases*" ... if you have increasing gradient to decreasing gradient - that's a change of sign of curvature. Decreasing gradient is negative curvature, by the way. – Glen_b May 14 '14 at 09:43
  • "if you have increasing gradient to decreasing gradient - that's a change of sign of curvature. Decreasing gradient is negative curvature, by the way." The point where the slope changes is the critical point and that's what is my interest is. Thanks Glen for helping me out. You are awesome! – orthopolis May 14 '14 at 20:34
  • Update: I tried to fit the logistic equation in gnupot but failed. I am getting a straight line parallel to x axis at y = 15. Either im guessing wrong initial parameters value or something else. Still trying out. @Glen – orthopolis May 14 '14 at 21:22
  • I found out my fit was not correct. So far failed to find a nice logistic fit equation. Nevertheless, this thread was a very good experience. Thanks Glen and all for your very time consuming explanation. You guys rock! – orthopolis May 19 '14 at 18:25
  • 1
    orthopolis -- I managed to get some (approximate) data out of your plot using an online tool for extracting data from plots. I can try fitting a logistic if you like. – Glen_b May 19 '14 at 23:39
  • @Glen, that would be highly appreciated! I can provide the data files if you want! You are the best! – orthopolis May 20 '14 at 20:38
  • Hi Glen, I managed to fit the data. However, I'm posting another question and would appreciate your input there! Many thanks once again! – orthopolis May 21 '14 at 18:00
  • @orthopolis sorry I didn't get a chance to fit that yet. I'll look for your other question when I can – Glen_b May 21 '14 at 23:08
  • No problem and thanks Glen. I have already posted the other question dealing with confidence interval. – orthopolis May 22 '14 at 04:25