3

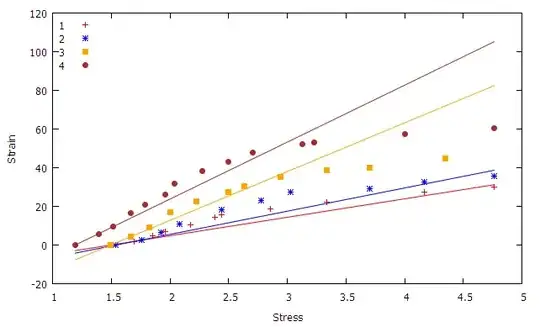
In the figure below, the stress-strain relationship is linear until they reach their corresponding plastic deformation points (A,B,C,D), beyond these points the relationship deviates from the linearity. The corresponding plastic deformation points shown in solid circles were actually determined by visual inspection (ball-parked). I am wondering if there is any better way to determine or quantify these points with any confidence level, say 90%.

enter image description here

(The above question is the second part of a previous question posted in this forum related to nonlinear fitting Here)

UPDATE: In the following first Figure, for each data set, I took first two points and fitted with a straight line. What was interesting that for each data set, the measured strain values were increasing on the left side of the linear fit and then gradually decreasing to the other side.

enter image description here

Then I took the difference between the measured and the predicted value, and plotted against the stress values as shown in the following figure. The points where the slopes changing are marked as in the figure in the original post.

enter image description here

But the same problem prevails,

  1. I had to chose the point based on my visual inspection
  2. Could not figure out how to choose confidence interval
  3. Not sure whether the procedure followed has any statistical significance

Any further comments would be highly appreciated.

Thanks!

orthopolis
  • 171
  • 1
  • 9
  • The graphic suggests you are expecting the points to be ordered from D through A along the stress axis. (If you were not, then you would have placed point B approximately at (3, 27) and D around (2.2, 36).) Is such an ordering of the deformation points a constraint you wish to impose on the estimates? – whuber May 22 '14 at 16:14
  • @whuber, You are right! But that's not my constraints. The order was observed in the actual data. – orthopolis May 22 '14 at 17:04
  • So if I am understanding you correctly, your question is really about a *single* set of stress-strain data (such as the blue data only, denoted "2" in the legend) and any procedure to find the plastic deformation point would be applied separately and independently to these four data sets, right? – whuber May 22 '14 at 17:07
  • That's very right! To add a little more information, the red data was produced using 800 RPM, blue with 1000, yellow with 1200 and brown with 1400. Thus red data with lower 800 RPM required more stress compared to brown data with higher 1400 rpm. Now rather than ball-park estimation, I was trying to quantify them with no success! – orthopolis May 22 '14 at 17:55

1 Answers1

1

NOTE: This suggestion did not work for the OP, as mentioned in the comments

A possible suggestion, iteratively appply least squares fitting to increasing parts of the curve and measure the standard deviation at each iteration At some point there should be a sharp difference of the standard deviation, by selecting a threshold you also select a confidence level. This simple algorithm will work but may not be efficient for large data. A randomized version of the above algorithm might be more efficient still. **UPDATE:** The solution outline posted does not seem to work (as intended) for the OP, see comments below the answer for further alternatives.
Nikos M.
  • 235
  • 1
  • 5
  • pleasure :), hope it helps – Nikos M. May 23 '14 at 17:34
  • Hi Nikos, say, I have 10 points in my data set. So at first, I should take first two points and fit them and calculate SD, then take first three points, then first four points and so on, and at each iteration calculate the SD. Did you mean that? TIA. – orthopolis May 27 '14 at 08:38
  • @orthopolis yes this is what i meant, alternatively you can partition your data and thus do fewer iterations (per data partition), e.g 1 partition is data 1-3, 2nd = data 3-5, and so on – Nikos M. May 27 '14 at 16:38
  • if using this later alternative you should compare SDs between successive partitions, additionaly the way you partition the data and the SD threshold are related to the confidence level (unfortunately i will have to work it out to say exactly what the relation is, but you get a picture) – Nikos M. May 27 '14 at 16:42
  • still another way i though right now is this: start with first 2 data points, estimate a line through them, predict the next point on this line and compute difference with actual 3rd data point, continue until the difference exceeds a given threshold – Nikos M. May 27 '14 at 16:45
  • If your data points have an inherent noise part (eg additive white noise), the previous mentioned procedures can use probabilistic threshold – Nikos M. May 27 '14 at 16:49
  • 1
    Thanks Nikos. I tried the first option. Taking first two points, then keep adding one more point and calculating their SD. When plotted x vs SD, did not see any significant jump in SD. The graph looks like identical to original stress-strain graph. I will report the second method you suggested, that is fitting and looking for the difference between the predicted minus actual value. – orthopolis May 27 '14 at 22:49
  • hmm yes this is possible, depending on amount of divergence from linearity and the effect of averaging (for computing SD), this may result in very fine tuning of threshold (and thus numerical issues). i think the partition method and the difference method posted earlier should be better. Thanks for letting me know – Nikos M. May 27 '14 at 22:55
  • 1
    **Note** that the way you resolve the succesive line estimation results in different algorithms. Possible options: 1) the line estimation remains the same (from first 2 points), this is better if you know positively that the data fits a line very closely up to a point, or equivalently can be modelled as linear up to some value. 2) Re-estimating the line, taking into account the new data point (either by an average or least-squares), this may over-fit sometimes. 3) Always use last 2 points. 4) Always use 1st and the last point. – Nikos M. May 27 '14 at 22:59
  • Still another way is using finite differences to compute the tangents of the fitted line (and proceed again by thresholding). These should be roughly equivalent – Nikos M. May 27 '14 at 23:03
  • Just finished the partition option, although this time it is not identical to the original stress-strain graph and shows some sort of "jump", but difficult to conclude something with confidence. I am now trying the "predicted-minus-the-original-value" option. – orthopolis May 28 '14 at 00:24
  • Ok just added an update in the original post since I do not know how to add figures in comment. Thanks! – orthopolis May 30 '14 at 23:23
  • if i understand correctly none of what was proposed in my answer was helpful? If this is so, downvote the answer and i will also add explanatory update so people with similar question do not get wrong results. Maybe a better answer appears – Nikos M. May 30 '14 at 23:34
  • Unfortunately none of them worked. And I'm not sure – orthopolis May 31 '14 at 05:24