I have a dependent variable C and an independent variable VPT.
VPT is the average volume per tree (in cubic foot) of a timber stand. C ist costs resulting from a cost function, that calculates the harvest costs per cubic foot (in $).
The plot between the two looks like this:
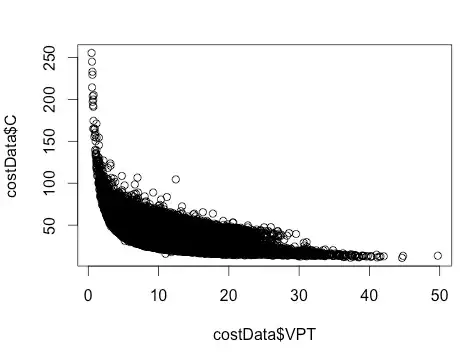
The abrupt change at roughly 28 cubic feet results from interaction within the cost function. I want to create a regression model for the two. Based on the graph I assume it must be something like this:
fit <- lm(C ~ I(VPT^(-1)))
Is there a way to determine what the best fit is? Do I just have to try around until I get something that fits, or is there a more efficient way?
The cost function takes in four parameters:
- Volume per tree (VPT)
- Trees per acre (TPA)
- Skidding Distance (SD)
- Slope (S)
Ultimately I want to create a regression that represents the cost function. Something like this:
fit <- lm(C ~ ß1xS + ß2xSD + ß3xTPA + ß4xVPT + ß5)