0

I wish to compare two test data sets using the Mann-Whitney U and KS tests in R.

As a start, I thought to compare two similar sets (an A/A test) expecting to see a highly significant indication of similarity.

The two lists are these shown below:

https://www.dropbox.com/s/9cbvzlltdohjoef/set1.csv https://www.dropbox.com/s/1p9fqdja2khrvi1/set2.csv

The results for the Mann-Whitney U test (wilcox.test) were:

W = 22073, p-value = 0.1948
alternative hypothesis: true location shift is not equal to 0

The results for the KS test (ks.test) were:

D = 0.1021, p-value = 0.2058
alternative hypothesis: two-sided

Why are neither of these statistically significant (p-value being below 0.05)?

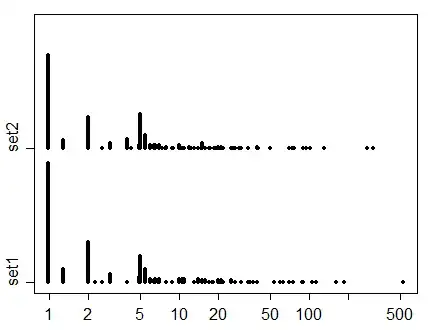
Here's a display of the values for the two sets:

stripchart set vs set2

Glen_b
  • 257,508
  • 32
  • 553
  • 939
Serenthia
  • 101
  • 3
  • If you believe these sets are similar, you should realize that the tests are, in a sense, tests of *dissimilarity*. That is, you should expect a non-significant result for similar sets. – gung - Reinstate Monica Apr 07 '14 at 18:13
  • Neither test can give you "a highly significant indication of similarity". You appear to misunderstand what these tests do. – Glen_b Apr 07 '14 at 22:45
  • There are many possible reasons for failing to achieve significance, including (but not limited to): (i) small sample size (leading to low power), (ii) a very small effect size/little difference in populations (perhaps even one so small as to be of no practical importance), (iii) using a test with low power against alternatives of interest, (iv) test assumptions unsatisfied in a way that leads to low power. It looks to me like the last one may be part of the story - your distribution is somewhat discrete (e.g. a big spike at 0.99 and a moderate one at 4.99 -- prices, right?). – Glen_b Apr 07 '14 at 23:11
  • That discreteness causes both the tests you mention to have lower than nominal type I error rate and hence, low power. If these are prices, by the way, you raise yet another possible reason for low power - an important, hidden variable, which is whatever (apparently different) items these things are prices *of*. See [Simpson's paradox](http://en.wikipedia.org/wiki/Simpson%27s_paradox) - this omission of an important explanatory variable can lead strongly different means to appear similar, or very similar means to appear different. It can even flip the sign of a relationship. – Glen_b Apr 07 '14 at 23:17
  • It also raises the issue of pairing - if most of the items priced are the same across the two sets (paired data), but there are some omissions, your analysis is unsuitable in several ways (first ignoring the pairing; secondly, it's relative price, not difference in price, across very differently priced items that could be expected to differ). – Glen_b Apr 07 '14 at 23:30
  • 1
    I've taken the liberty of adding a display of your data to your question, which highlights (1) the discreteness issue that I mentioned; (2) the great range in size of values across both of the data sets; and (3) that the distributions are almost identical. There are many issues that should be addressed here (see my comments above) before much can be said, but I think the main problem is as addressed by gung and the link whuber has indicated. I also notice that there's another big spike at 1.98, which I missed in a visual inspection before. – Glen_b Apr 07 '14 at 23:39
  • Thank you very much for your explanations. I think I understand what you're saying - these particular p-values do not give any indication that we should reject the null hypothesis. Upon consideration, this makes sense when the two samples are so similar. Thanks again. – Serenthia Apr 08 '14 at 09:38

0 Answers0