10

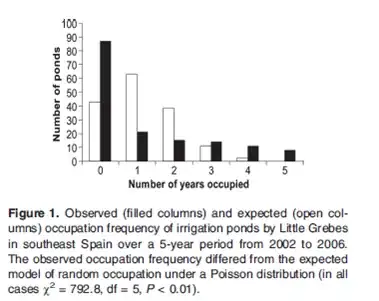
The figure below (Figure 1 from p. 646 of this paper) compares observed values against expected values under the Poisson distribution. It then runs a chi-squared test to see if the observed values differ from the expected values under Poisson distribution.

enter image description here

Using R, how is it possible to generate expected values under Poisson distribution and compare observed values using a chi-squared test?

EDIT:

Here's my attempt at doing what they did in paper. I want to know if the observed distribution of variable differs from a Poisson distribution. I also want to know if what I have done below is the same procedure as what they did in paper. As the P-value is >0.05, I have concluded below that the distribution of variable follows a Poisson distribution - could someone confirm this?

df <- data.frame(variable = 0:5, frequency = c(20, 10, 5, 3, 2, 1))

# estimate lambda
mean_df_variable <- mean(df$variable)

# calculate expected values if df$frequency follows a poisson distribution
library(plyr)
expected <- laply(0:5, function(x) dpois(x=x, lambda=mean_df_variable, log = FALSE))

# calculate actual distribution of df$frequency
observed <- df$frequency/sum(df$frequency)

# does distribution of df$frequency differ from a poisson distribution? Apparently 
#   not because P-value is > 0.05
chisq.test(expected, observed)
gung - Reinstate Monica
  • 132,789
  • 81
  • 357
  • 650
luciano
  • 12,197
  • 30
  • 87
  • 119
  • I don't quite follow your question. The expected value of a [Poisson distribution](http://en.wikipedia.org/wiki/Poisson_distribution) is $\lambda$, the mean. That doesn't have anything to do w/ R. If you have expected & observed values, you can do a chi-squared test manually in R; I show how to do that here: [What is wrong with this chi-squared calculation?](http://stats.stackexchange.com/a/85906/7290) – gung - Reinstate Monica Apr 05 '14 at 15:54
  • **The paper applies the chi-squared distribution incorrectly:** because two of the expected frequencies are tiny, and it has only five df, the chi-squared distribution will not be a reliable way to compute the p-value. This could be anticipated *before* observing the data. A correct test could be constructed by using $0,$ $1,$ $2,$ and $\ge 3$ for the bins (again, before observing the data). The Poisson parameter would have to be estimated using Maximum Likelihood based on these four bin counts, too. (Clearly, though, the observations are not Poisson, so the conclusion won't change.) – whuber Feb 08 '22 at 16:19

3 Answers3

12

The way you did the chi-squared test is not correct. There are several issues. First, your data frame looks like this:

  variable frequency
1        0        20
2        1        10
3        2         5
4        3         3
5        4         2
6        5         1

So when you run mean(df$variable), you get 2.5, which is just the mean of 0:5. That is, it is unweighted. Instead, create your variable like this:

x = rep(0:5, times=c(20, 10, 5, 3, 2, 1))
table(x)
# x
#  0  1  2  3  4  5 
# 20 10  5  3  2  1
mean(x)
# [1] 1.02439

The table() call shows that the code gives us what we wanted, and so mean() estimates lambda correctly.

Next, your estimated probabilities only go to 5, but the Poisson distribution goes to infinity. So you need to account for the probabilities of the values that you don't have in your dataset. This is not hard to do, you just calculate the complement:

probs = dpois(0:5, lambda=mean(x))
probs
# [1] 0.359015310 0.367771781 0.188370912 0.064321775 0.016472650 0.003374884
comp = 1-sum(probs)
# [1] 0.0006726867

Lastly, in R's chisq.test() function, the x= and y= arguments aren't exactly for the expected and observed values in the way you set this up. For one thing, what you are calling "expected" are actually probabilities (i.e., the output from dpois()), to make these expected values, you would have to multiply those probabilities (and be sure to include the compliment) by the total count. But even then, you wouldn't use those for y=. At any rate, you don't actually have to do that, you can just assign the probabilities to the p= argument. In addition, you will need to add a 0 to your observed values vector to represent all of the possible values that don't show up in your dataset:

chisq.test(x=c(20, 10, 5, 3, 2, 1, 0), p=c(probs, comp))

#  Chi-squared test for given probabilities
# 
# data:  c(20, 10, 5, 3, 2, 1, 0)
# X-squared = 12.6058, df = 6, p-value = 0.04974
# 
# Warning message:
#   In chisq.test(x = c(20, 10, 5, 3, 2, 1, 0), p = c(probs, comp)) :
#   Chi-squared approximation may be incorrect

The warning message suggests we may prefer to simulate instead, so we try again:

chisq.test(x=c(20, 10, 5, 3, 2, 1, 0), p=c(probs, comp), simulate.p.value=TRUE)

# Chi-squared test for given probabilities with simulated p-value 
#   (based on 2000 replicates)
# 
# data:  c(20, 10, 5, 3, 2, 1, 0)
# X-squared = 12.6058, df = NA, p-value = 0.07046

This is presumably a more accurate p-value, but it raises a question about how it should be interpreted. You ask "As the P-value is >0.05, I have concluded below that the distribution of variable follows a Poisson distribution - could someone confirm this?" Using the correct approach, we note that the first p-value was just <.05, but the second (simulated) p-value was just >.05. Although the latter p-value is more accurate, I would not rush to conclude that the data did come from a Poisson distribution. Here are some facts to bear in mind:
gung - Reinstate Monica
  • 132,789
  • 81
  • 357
  • 650
  • 1
    Because we fit the Poisson model to this data using the mean calculated from the data, we lose one df. The test statistic is approximately chi squared with 5 df. This means you cannot actually use `chisq.test` to calculate the p-value, you have to do it by hand (or use other tools). The value of X-squared is correct, but with 5 df you get p = 0.027. This is further from the simulated value, but the simulated value is simulating using a pre-fit Poisson model so it's not accurate either. – Bryan Clair Aug 02 '20 at 02:24
3

If I have understood what you meant you should:

  1. estimate the parameter of the Poisson distribution for your data, assuming it is Poisson distributed, say
lambdaEst = mean(x)
  1. calculate, for each $0,1, 2, ...$, their theoretical probabilities assuming a Poisson distribution, for example
probTheo0 = dpois(x = 0, lambda = lambdaEst, log = FALSE)
  1. then compare actual with theoretical probabilities via a chi-square test following this approach ChiSquare Test CV solution
vkehayas
  • 701
  • 5
  • 13
Giorgio Spedicato
  • 3,444
  • 4
  • 29
  • 39
  • 1
    Any decent software will tell you there is a problem with this: the expected counts in many of the bins will be too small. Indeed, the basic questions that arise are (1) how to choose the bins (where will you cut them off at the high levels?) and (2) how to estimate the Poisson parameter for the purpose of the Chi-squared test. (Hint: it's *not* the mean of the data!) – whuber Feb 08 '22 at 16:21
-1

This small script would work for any data.frame with observations:

df <- data.frame(variable = 0:5, frequency = c(20, 10, 5, 3, 2, 1))
N <- df$variable
observed <- df$frequency / sum(df$frequency)
lambdaEst <- sum(observed * N)
probs <- dpois(df$variable, lambda = lambdaEst)
comp = 1 - sum(probs)
chisq.test(x= c(rev(sort(df$frequency)),0), p=c(probs, comp))
  • 3
    Welcome to CV! It looks this solution could work well, but it deserves an explanation. And what should the user do to respond to the warning message saying the result might be incorrect? – whuber Dec 16 '21 at 23:45