Can there be negative correlation but the regression line has a positive change when there is an increase in the independent variable?
Asked
Active
Viewed 231 times
1 Answers
1
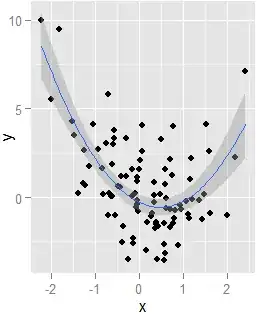
Yes. One simple case to consider is curvilinear regression, in which the response variable is modeled as a polynomial function of the predictor. I offer an example in r using $y_i=\beta_1x_i+\beta_2x_i^2+\varepsilon_i$.
First, some random data that fits the model: x=rnorm(99);y=x^2-x+2*rnorm(99);XY=data.frame(x,y)
Using set.seed(1), the correlation (cor(x,y)) $r_{x,y}=-.35$. Next, a curvilinear regression plot:
require(ggplot2);ggplot(XY,aes(x,y))+geom_point()+geom_smooth(method=lm,formula=y~x+I(x^2))
Finally, just to demonstrate that the model should curve like this, summary(lm(y~x+I(x^2),XY)):
Coefficients:
            Estimate Std. Error t value Pr(>|t|)
(Intercept)  -0.2772     0.2368  -1.171    0.245
x            -1.1893     0.2163  -5.498 3.17e-07 ***
I(x^2)        1.2602     0.1697   7.427 4.55e-11 ***
---
Signif. codes:  0 '***' 0.001 '**' 0.01 '*' 0.05 '.' 0.1 ' ' 1

Residual standard error: 1.916 on 96 degrees of freedom
Multiple R-squared: 0.4446, Adjusted R-squared: 0.4331
F-statistic: 38.43 on 2 and 96 DF,  p-value: 5.496e-13
For more statistics on how much better the polynomial model fits versus the simple linear model, use anova(lm(y~x,XY),lm(y~x+I(x^2),XY)):
Analysis of Variance Table

Model 1: y ~ x
Model 2: y ~ x + I(x^2)
  Res.Df    RSS Df Sum of Sq      F    Pr(>F)
1     97 554.83
2     96 352.38  1    202.45 55.153 4.552e-11 ***
---
Signif. codes:  0 '***' 0.001 '**' 0.01 '*' 0.05 '.' 0.1 ' ' 1
This example fits two conceivable interpretations of your question's premises:
- Beyond the global minimum at $x=.472$, predictions of $\hat y$ increase.
- The slope of the regression line changes positively as $x$ increases.
And of course, $x$ correlates negatively with $y$, as noted above.
Nick Stauner
- 11,558
- 5
- 47
- 105
-
I think correlation coefficients are useless for curvilinear relationships. – Chamberlain Mbah Apr 04 '14 at 09:33
-
Not entirely sure about "useless", but certainly misleading if one doesn't graph one's data and consider curvilinearity (among other pitfalls). Anscombe made this point in the second set of [his quartet](https://en.wikipedia.org/wiki/Anscombe%27s_quartet). – Nick Stauner Apr 04 '14 at 09:42