35

I have two classifiers

  • A: naive Bayesian network
  • B: tree (singly-connected) Bayesian network

In terms of accuracy and other measures, A performs comparatively worse than B. However, when I use the R packages ROCR and AUC to perform ROC analysis, it turns out that the AUC for A is higher than the AUC for B. Why is this happening?

The true positive (tp), false positive (fp), false negative (fn), true negative (tn), sensitivity (sen), specificity (spec), positive predictive value (ppv), negative predictive value (npv), and accuracy (acc) for A and B are as follows.

+------+---------+---------+
|      |    A    |    B    |
+------+---------+---------+
| tp   | 3601    | 769     |
| fp   | 0       | 0       |
| fn   | 6569    | 5918    |
| tn   | 15655   | 19138   |
| sens | 0.35408 | 0.11500 |
| spec | 1.00000 | 1.00000 |
| ppv  | 1.00000 | 1.00000 |
| npv  | 0.70442 | 0.76381 |
| acc  | 0.74563 | 0.77084 |
+------+---------+---------+

With the exception of sens and ties (spec and ppv) on the marginals (excluding tp, fn, fn, and tn), B seems to perform better than A.

When I compute the AUC for sens (y-axis) vs 1-spec (x-axis)

aucroc <- auc(roc(data$prediction,data$labels));

here is the AUC comparison.

+----------------+---------+---------+
|                |    A    |    B    |
+----------------+---------+---------+
| sens vs 1-spec | 0.77540 | 0.64590 |
| sens vs spec   | 0.70770 | 0.61000 |
+----------------+---------+---------+

So here are my questions:

  • Why is the AUC for A better than B, when B "seems" to outperform A with respect to accuracy?
  • So, how do I really judge / compare the classification performances of A and B? I mean, do I use the AUC value? Do I use the acc value, and if so why?
  • Furthermore, when I apply proper scoring rules to A and B, B outperforms A in terms of log loss, quadratic loss, and spherical loss (p < 0.001). How do these weigh in on judging classification performance with respect to AUC?
  • The ROC graph for A looks very smooth (it is a curved arc), but the ROC graph for B looks like a set of connected lines. Why is this?

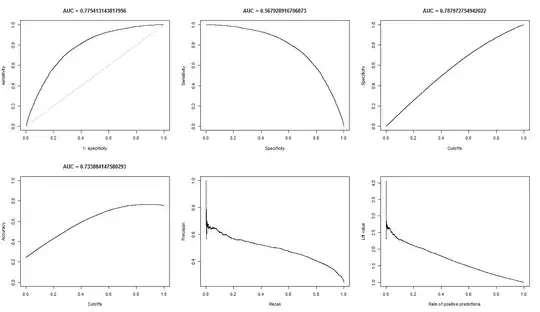
As requested, here are the plots for model A.

model A naive bayes net

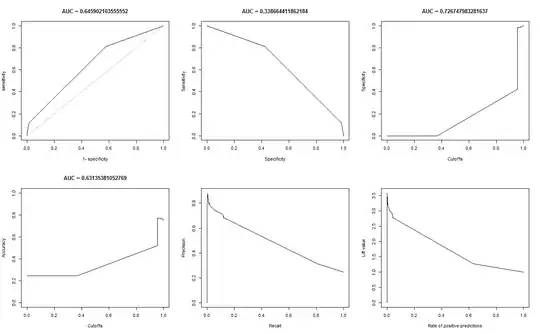
Here are the plots for model B.

model B regular bayes net

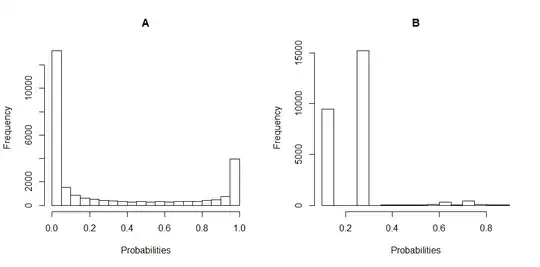
Here are the histogram plots of the distribution of the probabilities for A and B. (breaks are set to 20).

histogram plot

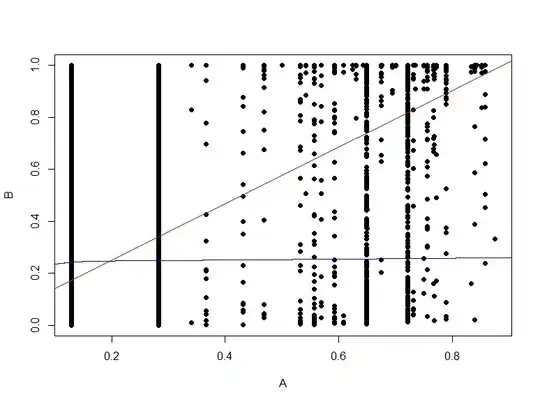
Here is the scatter plot of the probabilities of B vs A.

scatter plot

gung - Reinstate Monica
  • 132,789
  • 81
  • 357
  • 650
Jane Wayne
  • 1,268
  • 2
  • 14
  • 24
  • 1
    Your tables don't make sense: how did you choose the point at which you compute those performance values? – Calimo Mar 20 '14 at 07:32
  • 3
    Remember AUC measures the performance *over all possible thresholds*. It would help (you as well) if you could show the curves (ideally on the same plot). – Calimo Mar 20 '14 at 07:32
  • @Calimo sorry, i forgot to include that information, but the threshold used to create that confusion matrix was 50%. – Jane Wayne Mar 20 '14 at 17:02
  • You mean 0.5? The predicted values of A and B look clearly different, and if you haven't got the hint yet, you should definitely plot the histograms side by side... – Calimo Mar 20 '14 at 17:37
  • @Calimo could you please clarify, the histograms of what side-by-side? – Jane Wayne Mar 20 '14 at 17:49
  • @JayneWayne The histograms of your predicted values. `hist(data$prediction)`. They are very different - using the same threshold is clearly the source of your confusion here. – Calimo Mar 20 '14 at 19:03
  • @Calimo yes, you are right, that was part of the confusion. i computed "accuracy" with the threshold set to 0.5. but the ROC curve is created with thresholds set from [0.0, 1.0], and then the AUC is the area under the ROC curve. i've added the histograms for A and B, does anything point out as awkward to you? – Jane Wayne Mar 20 '14 at 20:11
  • Notice how (nearly) no predicted value is > 0.5 for B? With a cutoff at 0.5, you reduce your test B to a "everything is negative" test. So 100% specificity, and your specificity to basically anything between 0 and 1 due to the low number of observations there... – Calimo Mar 20 '14 at 20:18

3 Answers3

32

Improper scoring rules such as proportion classified correctly, sensitivity, and specificity are not only arbitrary (in choice of threshold) but are improper, i.e., they have the property that maximizing them leads to a bogus model, inaccurate predictions, and selecting the wrong features. It is good that they disagree with proper scoring (log-likelihood; logarithmic scoring rule; Brier score) rules and the $c$-index (a semi-proper scoring rule - area under ROC curve; concordance probability; Wilcoxon statistic; Somers' $D_{xy}$ rank correlation coefficient); this gives us more confidence in proper scoring rules.

Frank Harrell
  • 74,029
  • 5
  • 148
  • 322
  • +1. Could you explain why area under the ROC curve is not a proper scoring rule? What is its downside compared to proper ones? I'd really like to know where to find more information about these things. – Marc Claesen Mar 20 '14 at 15:07
  • 8
    I wish I had a good reference for that, but briefly any measure based solely on ranks such as $c$ (AUROC) cannot give enough credit to extreme predictions that are "correct". Brier, and even more so the logarithmic scoring rule (log likelihood) give such credit. This is also an explanation why comparing two $c$-indexes is not competitive with other approaches power-wise. – Frank Harrell Mar 20 '14 at 16:35
  • 1
    @FrankHarrell but my results for the proper scoring rules suggests B is better than A, which contradicts what the AUC suggests. so AUC is semi-proper, shouldn't it at least also indicate B is better than A? – Jane Wayne Mar 20 '14 at 17:23
  • 2
    Different measures and disagree, otherwise we'd always use one measure. I would supplement your analysis with a bias-corrected calibration curve and a scatter plot of predictions (one model against the other). – Frank Harrell Mar 20 '14 at 20:08
  • @FrankHarrell from a learning theory perspective, doesn't this somewhat neglect the fact that (in general) one is ultimately interested in picking a classifier that minimizes generalization error? In this case 0.5 isn't arbitrary at all, but is really the only reasonable thing to do assuming we want to minimize the number of mistakes. I'm thinking along the lines of the discussion [here](http://hunch.net/?p=547). Not disagreeing, just genuinely interested. – alto Mar 20 '14 at 20:09
  • @FrankHarrell the scatter plot is interesting. i will do that. please let me know if i'm wrong. but the scatter plot will plot probabilities of A vs B for each corresponding point. i'll also try the calibration curve. thank you so much. – Jane Wayne Mar 20 '14 at 20:17
  • 1
    @alto, 0.5 is extremely arbitrary, coinciding with a most unusual utility/loss/cost function in which two kinds of errors are equally bad. This is seldom the case. Thinking probabilistically, which is the way I happen believe the way nature works, there is no such thing as a "mistake", but rather a degree of badness of a risk prediction. For example, predicting a probability of 0.6 then observing an event is worse than predicting a probability of 0.9 and then observing an event. But neither prediction is "wrong". You can use probability accuracy scores that require no thresholds. – Frank Harrell Mar 20 '14 at 22:20
  • @FrankHarrell I have 2 questions: 1. Is the c-index (i.e. AUC) proper or not in your views? 2. You seem to say that selecting models based on c-index is not advisable because of "extreme predictions" (?) and better use Brier score, right? – teucer Mar 21 '14 at 11:02
  • I answered that question earlier. What would make you use anything for selecting models other than the gold standard log likelihood or better to fit all candidate predictors using penalized maximum likelihood estimation? – Frank Harrell Mar 21 '14 at 12:12
  • @FrankHarrell, but if I know the cost of mistakes and class distribution I can always derive the correct threshold. Furthermore, the fact that log-loss is "unbounded on the interval of interest" can cause serious problems with stability and [overfitting](http://yaroslavvb.blogspot.com/2007/06/log-loss-or-hinge-loss.html). Tangentially, I tend to think of nature as working in the opposite way, i.e., it forces the agent to make a decision. Whether I get to update my beliefs depends on the game. Choosing to hide in the bush instead of the tree and getting eaten by the lion is certainly a mistake. – alto Mar 21 '14 at 13:56
  • 3
    An unbounded model such as the logistic does not lead to any more overfitting than any other approach. The logistic transformation ensures that probability estimates are well behaved. The only downside to a logarithmic scoring rule is if you predict a probability extremely close to 0 or 1 and you are "wrong". It is true that one ultimately makes a decision but it does not follow at all that the analyst should make the decision by using a threshold. The decision should be deferred to the decision maker. Nate Silver's book Signal and Noise documents great benefits of probabilistic thinking. – Frank Harrell Mar 21 '14 at 16:43
  • @FrankHarrell, if you've taken my point be that one shouldn't think probabilistically, I must have misrepresented it (these are all just estimations of event probabilities anyway). I'm also not advocating hiding probabilities from decision makers. I'm simply saying that error analysis (precision, recall, AUC, etc) shouldn't be dismissed unilaterally. They can provide important information about expected model performance. Also, I previously linked to an example were optimizing log-loss can get you into overfitting trouble that you wouldn't have using something like hinge-loss. – alto Mar 21 '14 at 19:52
  • I have never seen an ROC curve that changed the way someone thought about a problem or provided real insight. I fail to understand how improper accuracy scoring rules are helpful. And I stand by my statement that log-likelihood does not increase overfitting. – Frank Harrell Mar 21 '14 at 19:56
  • To follow up on a comment by @alto, the use of thresholds at the analysis stage has this analogy to the decision about the lion: someone has given you a set of threshold-based rules that you are forced to apply in the field, creating an automatic "hide in the bush or tree" response if the criteria apply. Your current utilities and other observations (e.g., seeing that the tree branch is about to give way) while you are at the decision point are ignored. We have to be careful not to assume that the analyst is the decision maker. – Frank Harrell Mar 22 '14 at 12:17
  • 1
    @FrankHarrell, it is frustrating that you keep misconstruing my opinion. I never advocated a black box approach. I simply think your statement "x is useless, only use y" is too strong. – alto Mar 22 '14 at 14:51
  • 1
    @alto it probably is too strong, but I do feel strongly that dichotomizing continuous variables (on both the input and the output side of the model) creates arbitrariness, inefficiency, and is inconsistent with optimum decision making. – Frank Harrell Mar 22 '14 at 15:45
  • @FrankHarrell perhaps some of this disagreement has to do with background. As an ML person, the types of problems I'm interested in tend to be ones where the goal is to remove the human decision maker from the loop. I'm thinking of things like image recognition, content recommendation, ad serving, etc. Anyway, as I'm always quite keen to be enlightened (being wrong is a great way to learn), I've opened a [question](http://stats.stackexchange.com/q/91088/6248) regarding this topic. – alto Mar 24 '14 at 18:42
  • 4
    @alto that is perceptive. I think that real-time pattern recognition does not have time for utilities. This is not the world I work in. But still there are cases in real time where you would rather have a black box tell you "uncertain" than force a choice between "that is a tank coming at you" vs. "that is a passenger car". – Frank Harrell Mar 24 '14 at 18:47
18
  1. Why is the AUC for A better than B, when B "seems" to outperform A with respect to accuracy?

    Accuracy is computed at the threshold value of 0.5. While AUC is computed by adding all the "accuracies" computed for all the possible threshold values. ROC can be seen as an average (expected value) of those accuracies when are computed for all threshold values.

  2. So, how do i really judge/compare the classification performances of A and B? I mean, do i use the AUC value? do i use the acc value? and why?

    It depends. ROC curves tells you something about how well your model your model separates the two classes, no matter where the threshold value is. Accuracy is a measure which works well usually when classes keeps the same balance on train and test sets, and when scores are really probabilities. ROC gives you more hints on how model will behave if this assumption is violated (however is only an idea).

  3. furthermore, when i apply proper scoring rules to A and B, B outperforms A in terms of log loss, quadratic loss, and spherical loss (p < 0.001). how do these weigh in on judging classification performance with respect to AUC?

    I do not know. You have to understand better what you data is about. What each model is capable to understand from your data. And decide later which is the best compromise. The reason why that happens is that there is no universal metric about a classifier performance.

  4. The ROC graph for A looks very smooth (it is a curved arc), but the ROC graph for B looks like a set of connected lines. why is this?

    That is probably because the bayesian model gives you smooth transitions between those two classes. That is translated in many threshold values. Which means many points on ROC curve. The second model probably produce less values due to prediction with the same value on bigger regions of the input space. Basically, also the first ROC curve is made by lines, the only difference is that there are so many adjacent small lines, that you see it as a curve.

rapaio
  • 6,394
  • 25
  • 45
  • 1
    Accuracy can be computed at threshold values other than 0.5. – Calimo Mar 20 '14 at 10:02
  • 1
    Of course you are right. That is why I used "accuracies" in the next proposition. However, when one talks about accuracy, without other context information, the best guess for the threshold value is 0.5. – rapaio Mar 20 '14 at 10:23
  • 2
    It is easy to see how arbitrary such a process is. Few estimators in statistics that require binning or arbitrary choices have survived without heavy criticism. And I would never call proportion classified correct as "accuracy". – Frank Harrell Mar 20 '14 at 16:36
  • @unreasonablelearner you are right on your assumption.. the confusion matrix above was computed at the threshold 0.5. is there any advantage to a different threshold? – Jane Wayne Mar 20 '14 at 16:46
  • @unreasonablelearner on "there is no universal metric on classifier performance," that is quite true. but in some fields, the literature is biased extremely towards using one. in my case, AUC is what they want to compared. – Jane Wayne Mar 20 '14 at 16:50
  • @FrankHarrell I use term "accuracy" solely since I believe it is a widely used term for proportion of classified correct. Nothing more. But now I see I was wrong. – rapaio Mar 20 '14 at 17:19
  • @unreasonablelearner how are you wrong? i computed accuracy = (tp + tn) / (tp + tn + fp + fn). isn't that the proportion of classified correct? according to what i did, you are right because of how i computed accuracy. – Jane Wayne Mar 20 '14 at 17:26
  • 1
    @JaneWayne The formula is indeed for the proportion of classified correct. Accuracy is the most often used term for this. However accuracy means a lot more, and in the light of what Frank Harrell said, I think now that accuracy is by far not the best term for that. Now I think that its usage might harm, even if it is popular. This is how I was wrong. – rapaio Mar 20 '14 at 17:40
  • To me accuracy would be more related to the closeness of $\hat{P}rob(Y=1 | X)$ to $Prob(Y=1 | X)$. – Frank Harrell Mar 20 '14 at 21:17
5

Why is the AUC for A better than B, when B "seems" to outperform A with respect to accuracy?

First, although the cut-off (0.5) is the same, it is not comparable at all between A and B. In fact, it looks pretty different from your histograms! Look at B: all your predictions are < 0.5.

Second, why is B so accurate? Because of class imbalance. In test B, you have 19138 negative examples, and 6687 positives (why the numbers are different in A is unclear to me: missing values maybe?). This means that by simply saying that everything is negative, I can already achieve a pretty good accuracy: precisely 19138 / (19138 + 6687) = 74%. Note that this requires absolutely no knowledge at all beyond the fact that there is an imbalance between the classes: even the dumbest model can do that!

And this is exactly what test B does at the 0.5 threshold... you get (nearly) only negative predictions.

A is more of a mixed bag with. Although it has a slightly lower accuracy, note that its sensitivity is much higher at this cut-off...

Finally, you cannot compare the accuracy (a performance at one threshold) with the AUC (an average performance on all possible thresholds). As these metrics measure different things, it is not surprising that they are different.

So, how do I really judge/compare the classification performances of A and B? i mean, do i use the AUC value? do i use the acc value? and why?

Furthermore, when I apply proper scoring rules to A and B, B outperforms A in terms of log loss, quadratic loss, and spherical loss (p < 0.001). How do these weigh in on judging classification performance with respect to AUC?

You have to think: what is it you really want to do? What is important? Ultimately, only you can answer this question based on your knowledge of the question. Maybe AUC makes sense (it rarely really does when you really think about it, except when you don't want to make a decision youself but let others do so - that's most likely if you are making a tool for others to use), maybe the accuracy (if you need a binary, go-no go answer), but maybe at different thresholds, maybe some other more continuous measures, maybe one of the measures suggested by Frank Harrell... as already stated, there is no universal question here.

The ROC graph for A looks very smooth (it is a curved arc), but the ROC graph for B looks like a set of connected lines. Why is this?

Back to the predictions that you showed on the histograms. A gives you a continuous, or nearly-continuous prediction. To the contrary, B returns mostly only a few different values (as you can see by the "spiky" histogram).

In a ROC curve, each point correspond to a threshold. In A, you have a lot of thresholds (because the predictions are continuous), so the curve is smooth. In B, you have only a few thresholds, so the curve looks "jumps" from a SN/SP to an other.

You see vertical jumps when the sensitivity only changes (the threshold makes differences only for positive cases), horizontal jumps when the specificity only changes (the threshold makes differences only for negative examples), and diagonal jumps when the change of threshold affects both classes.

Calimo
  • 2,829
  • 17
  • 26
  • +1, however, it isn't the case that the AUC is only for "when you don't want to make a decision youself but let others do so". See: [How to calculate Area Under the Curve (AUC), or the c-statistic, by hand](http://stats.stackexchange.com/a/146174/7290). – gung - Reinstate Monica Jul 22 '16 at 21:05