2

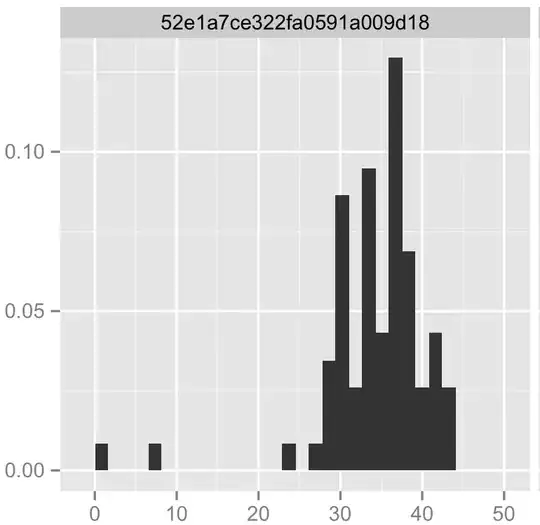
I am designing a points-scored test. There is a limit on the maximum amount of points possible, as well as on the fewest amount of points possible. I have had a test group take the test and graphed their results, which form a lopsided bell curve or sorts. I am trying to figure out what kind of distribution would be best to describe this distribution, for the purpose of using it to calculate percentile scores for any future test takers. I would use normal, but intuitively, I feel that the highest percentiles would never be reached, since they would be beyond the upper bound of the data set. Would a truncated normal distribution or beta distribution be best? Any help, intuitive or direct, would be appreciated. I am mostly working in the R environment.

Sample distribution of part of my data set.

Nick Stauner
  • 11,558
  • 5
  • 47
  • 105
Boris V.
  • 23
  • 2

2 Answers2

1

Unless (and maybe even if) you intend to disregard those low observations, I'd say this looks negatively skewed. See also Real life examples of distributions with negative skewness for some discussion of negative skew in testing scenarios. You haven't mentioned any predictor variable, so if you're just looking for a good estimate of central tendency, I recommend the median. The mean will be biased toward low scores if the distribution is negatively skewed, especially if you retain any outliers. If you use the median, I wouldn't bother to remove the outliers.
Of course, this is median() in the base package for R. Add na.rm=T if you have missing values.

Unless you're fitting a predictive model with distributional assumptions about the outcome that you haven't mentioned, I don't see much advantage to assuming a predefined theoretical distribution instead of just describing yours. Why not define your distribution empirically with density()? This should help you describe the probability of other scores, if you're not just interested in the most likely. Granted, this might not work ideally at the edges if it suggests nonzero probabilities out of bounds.

Nick Stauner
  • 11,558
  • 5
  • 47
  • 105
1

The beta is good because it is indeed bounded. It is quite flexible though it only has two parameters. You might also look at the Weibull distribution. If you really wanted maximum flexibility, you could try the generalized lambda distribution which has four parameters.

Dave31415
  • 1,073
  • 10
  • 14
  • 1
    Weibull looks pretty good (I simulated the density function evident in the OP's histogram with `plot(density(rweibull(100000,shape=9,scale=36)))`), but doesn't appear to fit the low observations. Even with a simulated sample of 10M, the lowest observation was 4.6. – Nick Stauner Mar 20 '14 at 02:30
  • 2
    Well, that may not matter. There doesn't appear to be very many data points here anyway. You could also transform it to make it look Gaussian. A log-normal is another to look at. Finally, you could consider it a mixture of say a Weibull or beta and a uniform one. – Dave31415 Mar 20 '14 at 02:39
  • 1
    If you don't fix the start and end points to say 0 and 1 (so that you can match the range of a bounded variable), a beta has 4 parameters. – Glen_b Mar 20 '14 at 02:40
  • lognormal? Why would you fit a right skew distribution to left skew data? – Glen_b Mar 20 '14 at 02:41
  • Well, you can flip easily enough. – Dave31415 Mar 20 '14 at 02:46
  • I suppose that is true about the beta but usually you don't have that freedom which is why you use the beta to begin with. Here for example, there is a definite min and max. – Dave31415 Mar 20 '14 at 02:47
  • Yeah, might not matter, but generalized lambda looks a little better than Weibull for those low observations (check out `plot(density(rgl(10000,med=36,iqr=5,chi=-.5,xi=.6)),xlim=c(0,50))` using the `gldist` package). Doesn't handle the lower bound well though, so you'd at least want a lower-bounded version of this. – Nick Stauner Mar 20 '14 at 02:50
  • I have to say, I think you are over-thinking this one! You really don't have enough data here to distinguish between all these distributions. It wouldn't surprise me if it came out very different for a different sample of students. Those two points close to zero could easily not have been there and then all of this would be moot as a beta or Weibull would fit just fine. For your purpose, it is probably not that important if you get the 5 percentile range that accurately. More important is how it works where most of the scores are going to be. – Dave31415 Mar 20 '14 at 02:55