1

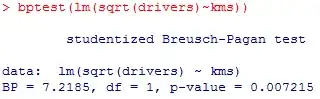
Can anyone explain why the BP, Breusch-Pagan, test rejects homoscedasticity with such an apparently randomized plot of residuals?

enter image description here

enter image description here

Info5ek
  • 1,051
  • 3
  • 11
  • 21

1 Answers1

2

You have drawn the wrong scatterplot, I believe.

You should have a scatterplot of the residuals against the fitted values from the model, not "index" which is just the order in which the observations went into the data set

Peter Flom
  • 94,055
  • 35
  • 143
  • 276
  • I used `plot(resid(lm(x)))` I'm confused because I thought the point of looking at residuals was to ensure that they are evenly scattered about the line Y = 0. – Info5ek Mar 16 '14 at 22:18
  • No. That is true by force. The point is to see if the residuals violate the assumptions of OLS regression: 1) Normally distributed 2) Not related to the fitted values 3) Constant variance at different levels. Try `plot(m1)` in `R`, where m1 is a linear model; this gives a good default set of graphs – Peter Flom Mar 16 '14 at 22:21
  • i replaced the initial plot with he residuals vs fitted plot – Info5ek Mar 16 '14 at 22:27
  • 3
    @user1800340, you don't want the residuals vs fitted. This plot tells you there is some curvature in the x y relationship that isn't being captured by your model. To assess homoscedasticity, you want to call `plot(model, which=2)`, which will give you scale-location plot (see my answer [here](http://stats.stackexchange.com/a/52107/7290)). – gung - Reinstate Monica Mar 16 '14 at 22:58