0

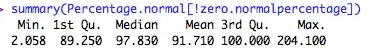
I have a set of data with summary as below:

data summary

The data are non-normal and transformations did not obtain normality.

Given the data are continuous I have narrowed the range of distribution down to 'Cauchy','Weibull','Gamma','f','Laplace'.

Below is the density plot for the data: density plot

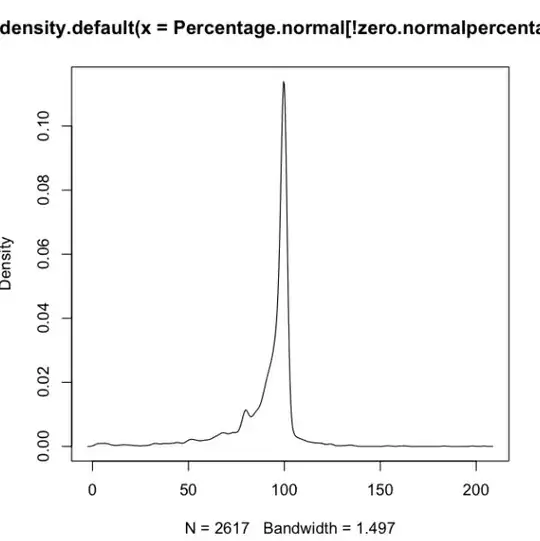
How do I determine the right distribution for the data?

  • 5
    You already *have* determined the distribution of the *data*: it is shown in your plot. What do you want to do with that distribution? What is the purpose of your analysis? – whuber Mar 07 '14 at 21:57
  • I need to find a probability distribution for the above data values . The values aren't normally distributed so I have to find another distribution that fits them. I don't know how to do that... – Coronita Mar 07 '14 at 23:26
  • 2
    Please tell us what you would be doing with that fitted distribution. It is rare that the sole objective of an analysis is to fit a distribution and it frequently turns out that what people *really* want to accomplish has little or nothing to do with distribution fitting. Your question exhibits signs of that; for instance, the titles in your graphics suggest the data are percentages of something (which therefore max out at 100 and should not even be plotted beyond that range) but none of the distributions you name would be appropriate for percentages. – whuber Mar 07 '14 at 23:42
  • It's almost certain that no 'named' distribution will be an exact description of the distribution of your data. Why do you need to have one? – Glen_b Mar 07 '14 at 23:50
  • This is for my undergraduate dissertation paper for a stats module. The initial data frame contains the amounts of insurance claim and payout for damaged buildings from an earthquake. Percentage is calculated from the 'claim' and 'payout'. In some cases the amount paid exceeds amount claimed, hence the values beyond 100. I need to find a model for the percentage of a claim that is awarded, i.e. the data values above. The model will then be used to estimate payout given claimed amount. – Coronita Mar 08 '14 at 00:18

1 Answers1

3

If you want to identify an off-the-shelf density and parametric fit I would use fitdistr() This function returns parameters and log-likelihood.

So if your data is x you would do something like:

fwei=fitdistr(x, "weibull")

for some densities you need to specify them by hand.

laplacedens <- function(x, m,b)   exp(-abs((x-m)/b))/2/b
flap=fitdistr(x, laplacedens, list(m = 0,b=1) )

Then compare the log-likelihoods:

    fwei$loglik
    flap$loglik 

I would definitely consider @whuber's warning in the comments above.

Seth
  • 577
  • 4
  • 11